

12. Which pairwise comparison shows the strongest effect? Question relate to the following repeated-measures ANOVA output. a)...
Question:
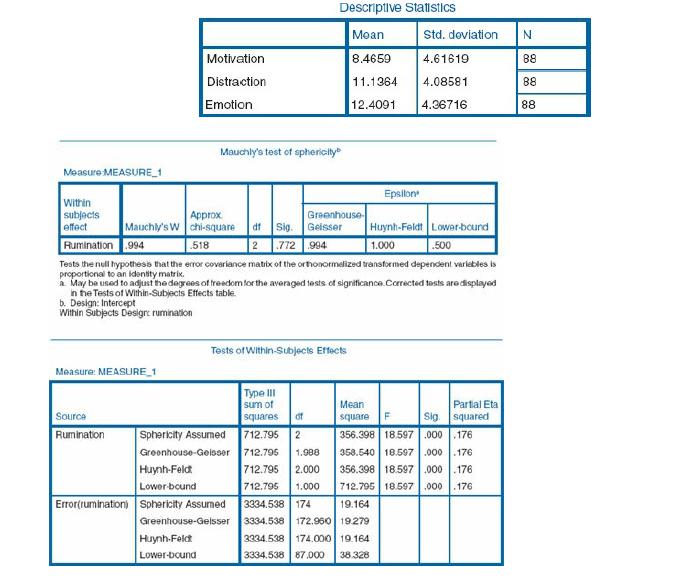
12. Which pairwise comparison shows the strongest effect?
Question relate to the following repeated-measures ANOVA output.
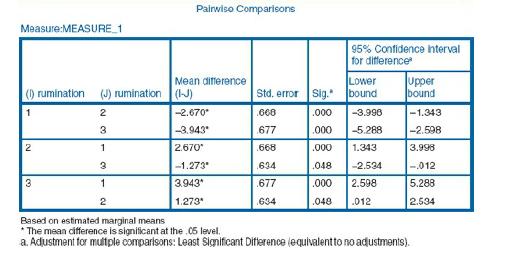
a) Conditions 1 and 2
b) Conditions 2 and 3
c) Conditions 1 and 3
d) We cannot tell
Fantastic news! We've Found the answer you've been seeking!
Step by Step Answer:

Answered By
Joseph Ogoma
I have been working as a tutor for the last five years. I always help students to learn and understand concepts that appears challenging to them. I am always available 24/7 and I am a flexible person with the ability to handle a wide range of subjects.
1+ Reviews
10+ Question Solved
Related Book For 
Statistics For The Health Sciences
ISBN: 9781849203364
1st Edition
Authors: Christine Dancey, John Reidy, Richard Rowe
Question Posted:
