

A local highway department compiled the following percentages from accident records according to traffic-control method (flashing red
Question:
A local highway department compiled the following percentages from accident records according to traffic-control method (flashing red light, two-way stop signs, or four-way stop signs) and accident severity (loss of life, major damage, and minor damage):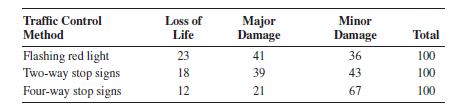
a. Present the data using three pie charts, one for each of the traffic-control methods.
b. Present all the data in a bar chart in a way that emphasizes differences between accident severity.
c. Present all the data in a bar chart in a way that emphasizes differences between the traffic-control methods.
d. Present the data as a column chart.
e. Discuss the advantages and disadvantages of each of the above graphical methods with respect to these data.
Step by Step Answer:


Probability Statistics And Reliability For Engineers And Scientists
ISBN: 9781439809518
3rd Edition
Authors: Bilal M. Ayyub, Richard H. McCuen
