

The following data give the age distribution of U.S. citizens as a function of age group. Select
Question:
The following data give the age distribution of U.S. citizens as a function of age group. Select a method for graphing the results. Interpret the results. Then combine the values into three meaningful groups and provide a graphical analysis of the distribution. How do the two analyses differ in their information content and emphasis?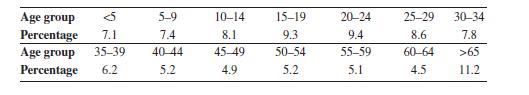
Fantastic news! We've Found the answer you've been seeking!
Step by Step Answer:

Answered By
Muhammad Ghyas Asif
It is my obligation to present efficient services to my clients by providing a work of quality, unique, competent and relevant. I hope you have confidence in me and assign me the order and i promise to follow all the instructions and keep time.
109+ Reviews
203+ Question Solved
Related Book For 

Probability Statistics And Reliability For Engineers And Scientists
ISBN: 9781439809518
3rd Edition
Authors: Bilal M. Ayyub, Richard H. McCuen
Question Posted:
