

Look at the following output, which compares the amount of movement measured in patients with Multiple Sclerosis
Question:
Look at the following output, which compares the amount of movement measured in patients with Multiple Sclerosis after treatment (0 = no movement, 5 = much movement) with those patients waiting for treatment (control group)
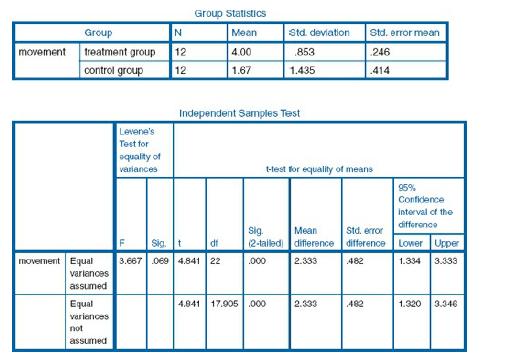
12. Which is the most appropriate conclusion?
a) Scores in the treatment group are more variable than the control group
b) Scores in the control group are more variable than the treatment group
c) The groups have identical variances
d) It is not possible to determine which group has the most variance
Fantastic news! We've Found the answer you've been seeking!
Step by Step Answer:

Answered By
AJIN KURIAKOSE
I HAVE ELECTRONICS ENGINEERING DEGREE..AND MY AREA OF INTEREST IS MATHEMATICS,CONTROL SYSTEM,NETWORK,DIGITAL
21+ Reviews
32+ Question Solved
Related Book For 

Statistics For The Health Sciences
ISBN: 9781849203364
1st Edition
Authors: Christine Dancey, John Reidy, Richard Rowe
Question Posted:
