Parts a through f list variables and measurements, and Figures 4.24a through 4.24f show visual representations of
Question:
Parts a through f list variables and measurements, and Figures 4.24a through 4.24f show visual representations of how their values are distributed. For each variable, identify the measure(s) of central tendency that would be appropriate to report.
a. Countries’ gross domestic product in dollars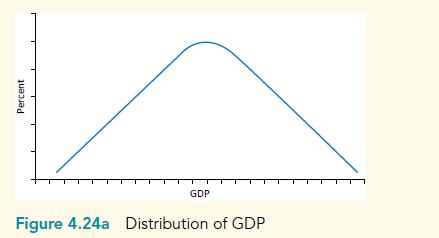
b. Political party: Democrat (1), Republican (2), Independent (3), Green (4), Libertarian (5), Other (6)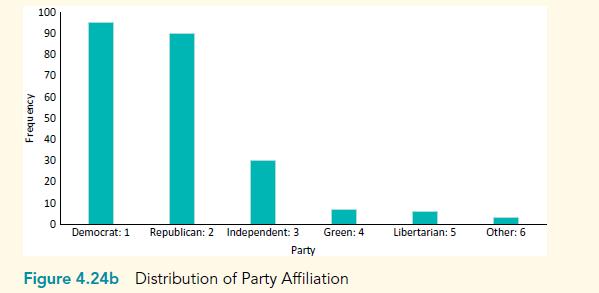
c. Strength of interest in politics, ranging from 1 (no interest) to 10 (very high interest)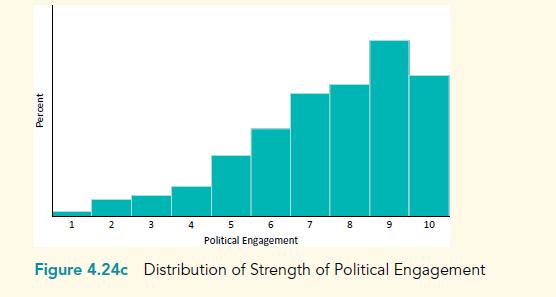
d. Agreement with the following statement: “Harsh punishment deters people from committing crime” (1 = strongly disagree, 2 = disagree, 3 = neither agree nor disagree, 4 = agree, 5 = strongly agree).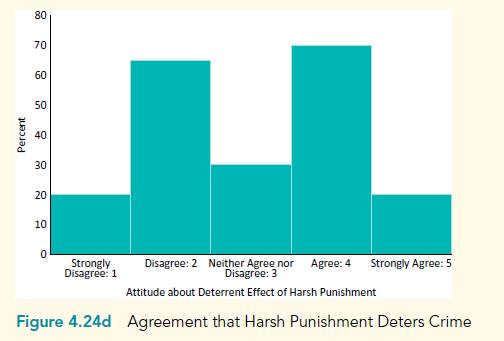
e. Agreement with the following statement: “Children do not benefit from having a high volume of daily homework” (1 = strongly disagree, 2 = disagree, 3 = agree, 4 = strongly agree, 5 = no opinion, 6 = I don’t know).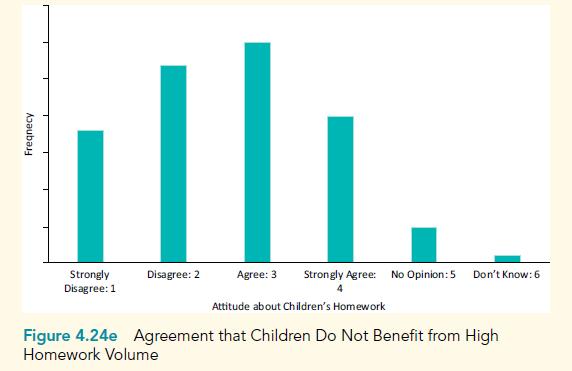
f. Favorite class: Statistics (1), Literature (2), Social Inequality (3), American Politics (4), Organic Chemistry (5), Sex and Gender (6)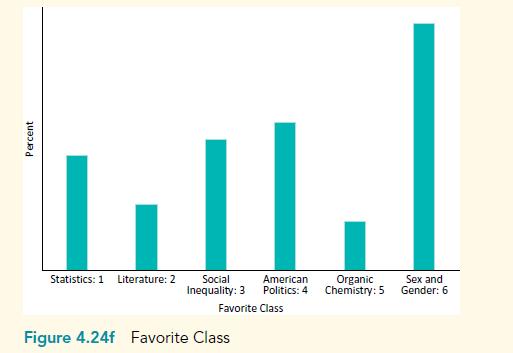
Step by Step Answer:

Statistics For Social Understanding With Stata And SPSS
ISBN: 9781538109847
2nd Edition
Authors: Nancy Whittier , Tina Wildhagen , Howard Gold


