

The scores on a test were distributed as shown below for a class of 60 students. Convert
Question:
The scores on a test were distributed as shown below for a class of 60 students. Convert the frequency histogram to a probability distribution. What is the probability that a student had a score of at least 90? What is the probability that a student failed the test (F grade), assuming that a score less than 70 was considered an F?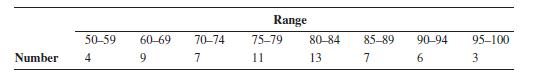
Fantastic news! We've Found the answer you've been seeking!
Step by Step Answer:

Answered By
Pushpinder Singh
Currently, I am PhD scholar with Indian Statistical problem, working in applied statistics and real life data problems. I have done several projects in Statistics especially Time Series data analysis, Regression Techniques.
I am Master in Statistics from Indian Institute of Technology, Kanpur.
I have been teaching students for various University entrance exams and passing grades in Graduation and Post-Graduation.I have expertise in solving problems in Statistics for more than 2 years now.I am a subject expert in Statistics with Assignmentpedia.com.
3+ Reviews
10+ Question Solved
Related Book For 

Probability Statistics And Reliability For Engineers And Scientists
ISBN: 9781439809518
3rd Edition
Authors: Bilal M. Ayyub, Richard H. McCuen
Question Posted:
