

Question: Two cities provided the following information on public school teachers' salaries. (a) Construct a boxplot for the salaries in City A. (b) Construct a boxplot,
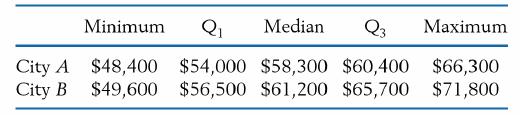
Two cities provided the following information on public school teachers' salaries.
(a) Construct a boxplot for the salaries in City A.
(b) Construct a boxplot, on the same graph, for the salaries in City B.
(c) Are there larger differences at the lower or higher salary levels? Explain.
Minimum Q Median Q3 Maximum City A $48,400 $54,000 $58,300 $60,400 $66,300 City B $49,600 $56,500 $61,200 $65,700 $71,800
Step by Step Solution
★★★★★
3.34 Rating (160 Votes )
There are 3 Steps involved in it
1 Expert Approved Answer
Step: 1 Unlock

a and b The boxplots for salaries in both cities are c Th... View full answer
Question Has Been Solved by an Expert!
Get step-by-step solutions from verified subject matter experts
Step: 2 Unlock
Step: 3 Unlock