

Question: Referring to the earthquake data in Exercise 2.20, (a) Find the sample mean and standard deviation. (b) What proportion of these observations lies between x
Referring to the earthquake data in Exercise 2.20,
(a) Find the sample mean and standard deviation.
(b) What proportion of these observations lies between x ± 2 s?
Data from in Exercise 2.20
In a recent year, 35 sites around the world experienced earthquakes of magnitude greater than 6.5.
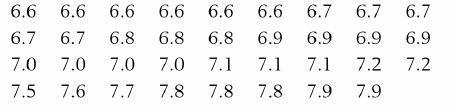
Construct a histogram using equal-length intervals starting with (6.5, 6.8 ], where the right-hand endpoint is included but not the left-hand endpoint.
6.6 6.6 6.6 6.6 6.6 6.6 6.7 6.7 6.7 6.8 6.9 6.9 6.9 6.9 7.0 7.0 7.0 7.0 7.1 7.1 7.1 7.2 7.2 6.7 6.7 6.8 6.8 7.5 7.6 7.7 7.8 7.8 7.8 7.9 7.9
Step by Step Solution
3.30 Rating (150 Votes )
There are 3 Steps involved in it
a Using software we obtain x 7051 and s 428 b The ... View full answer

Get step-by-step solutions from verified subject matter experts