

Question: Referring to the earthquake data in Exercise 2.20, (a) Obtain a five-number summary: minimum, Q 1 , Q 2 , Q 3 , maximum. (b)
Referring to the earthquake data in Exercise 2.20,
(a) Obtain a five-number summary: minimum, Q1, Q2, Q3, maximum.
(b) Construct a boxplot.
Data from in Exercise 2.20
In a recent year, 35 sites around the world experienced earthquakes of magnitude greater than 6.5.
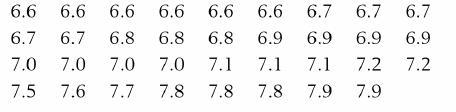
Construct a histogram using equal-length intervals starting with (6.5, 6.8 ], where the right-hand endpoint is included but not the left-hand endpoint.
6.6 6.6 6.6 6.6 6.6 6.6 6.7 6.7 6.7 6.7 6.7 6.8 6.8 6.8 6.9 6.9 6.9 6.9 7.0 7.0 7.0 7.0 7.1 7.1 7.1 7.2 7.2 7.5 7.6 7.7 7.8 7.8 7.8 7.9 7.9
Step by Step Solution
3.48 Rating (164 Votes )
There are 3 Steps involved in it
We give the boxplot obtained fro... View full answer

Get step-by-step solutions from verified subject matter experts