

Question: In Exercise D.47, we consider a regression model to use the number of alcoholic drinks a student has in a week to predict the number
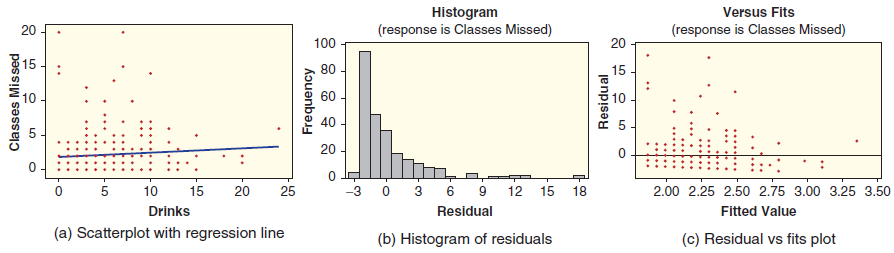
In Exercise D.47, we consider a regression model to use the number of alcoholic drinks a student has in a week to predict the number of classes missed in a semester. Here we check the conditions for using that regression model. Three graphs for this model are shown in Figure D.6: the scatterplot with regression line, a histogram of the residuals, and a scatterplot of residuals against predicted values. Discuss whether the conditions are met. Be sure to comment on all three graphs.
Figure D.6
Exercise D.47
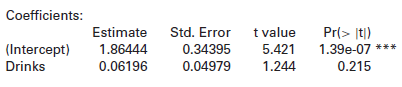
Is drinking alcohol a possible factor in students missing classes? In Data D.1 on page 599, we introduce the data in SleepStudy. Two of the variables in that study are Drinks, the number of alcoholic drinks in a week, and ClassesMissed, the number of classes missed during the semester. Computer output is shown for predicting the number of classes missed based on the number of drinks.
Versus Fits (response is Classes Missed) Histogram Classes Missed) (response is 20 100 20 80 15 15 60 10 10 40 20 5 2.00 2.25 2.50 2.75 3.00 3.25 3.50 Fitted Value (c) Residual vs fits plot 20 -3 0 3 25 15 12 10 15 Drinks 6 18 Residual (a) Scatterplot with regression line (b) Histogram of residuals Classes Missed 20 2- Frequency Residual Coefficients: | (Intercept) Drinks Estimate 1.86444 0.06196 Std. Error 0.34395 0.04979 t value 5.421 Pr(> It) 1.39e-07 *** 1.244 0.215
Step by Step Solution
3.43 Rating (156 Votes )
There are 3 Steps involved in it
There are several problems with the regression conditions the most serious of whic... View full answer

Get step-by-step solutions from verified subject matter experts