

Question: Is drinking alcohol a possible factor in students missing classes? In Data D.1 on page 599, we introduce the data in SleepStudy. Two of the
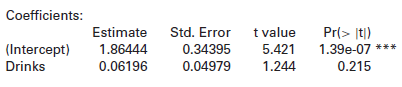
Is drinking alcohol a possible factor in students missing classes? In Data D.1 on page 599, we introduce the data in SleepStudy. Two of the variables in that study are Drinks, the number of alcoholic drinks in a week, and ClassesMissed, the number of classes missed during the semester. Computer output is shown for predicting the number of classes missed based on the number of drinks.
Residual standard error: 3.237 on 251 degrees of freedom
Multiple R-squared: 0.006131, Adjusted R-squared: 0.002172
F-statistic: 1.548 on 1 and 251 DF, p-value: 0.2145
(a) Interpret the slope of the regression line in context.
(b) Identify the t-statistic and the p-value for testing the slope. What is the conclusion, at a 5% level?
(c) Interpret R2 in context.
(d) Identify the F-statistic and p-value from the ANOVA for regression. What is the conclusion of that test?
Data D.1 on page 599
A recent study examines the relationship between class start times, sleep, circadian preference, alcohol use, academic performance, and other variables in college students. The data were obtained from a sample of students who did skills tests to measure cognitive function, completed a survey that asked many questions about attitudes and habits, and kept a sleep diary to record time and quality of sleep over a two-week period. Some data from this study are available in SleepStudy.
Coefficients: Std. Error 0.34395 0.04979 Pr(> It) 1.39e-07 *** t value 5.421 Estimate 1.86444 0.06196 | (Intercept) Drinks 1.244 0.215
Step by Step Solution
3.50 Rating (163 Votes )
There are 3 Steps involved in it
a The slope is b 1 00620 If the number of drinks goes u... View full answer

Get step-by-step solutions from verified subject matter experts