Lets use the Sampling Distribution of the Sample Mean web app accessible from the books website to
Question:
 a. Use the app to simulate the sampling distribution when the sample size n = 2. Run 10,000 simulations and look at the resulting histogram of the sample means. (You may want to decrease the binsize a bit to get a clearer picture.) What shape does the simulated sampling distribution have?
b. Repeat part a, but now use a sample size of n = 5. Explain how the variability and the shape of the simulated sampling distribution changes as n increases from 2 to 5.
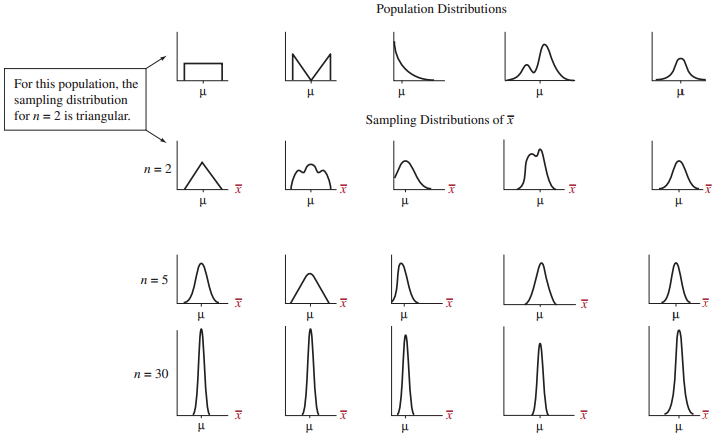
c. Repeat part a, but now use a sample size of n = 30. Explain how the variability and the shape of the simulated sampling distribution changes as n increases from 2 to 30. Compare results from parts a-c to the first column of Figure 7.11.
d. Explain how the central limit theorem describes what you have observed.
Step by Step Answer:

Statistics The Art And Science Of Learning From Data
ISBN: 9780321997838
4th Edition
Authors: Alan Agresti, Christine A. Franklin, Bernhard Klingenberg


