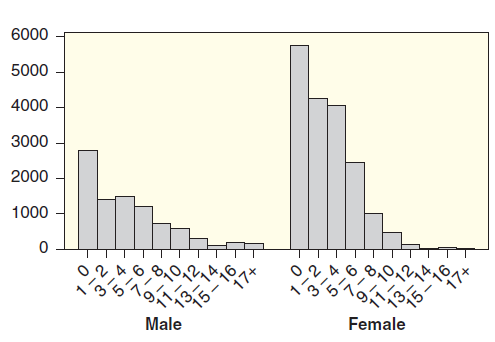
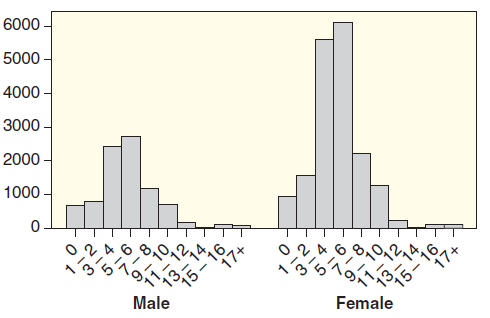
Students in the ACHANCHA survey were asked two questions about alcohol use, one about their own personal
Question:
Figure 2.3
a.

b.

(a) What is the most likely response for both males and females when asked about their own personal alcohol use?
(b) What is the most likely response for both males and females when asked about alcohol use of a €˜€˜typical student€?
(c) Do students€™ perceptions of €˜€˜typical€ alcohol use match reality? (This phenomenon extends what we learned about the inability of students to select unbiased samples in Chapter 1. In this case, students tend to notice heavy drinkers disproportionately.)
Use data on college students collected from the American College Health Association€“National College Health Assessment survey conducted in Fall 2011. The survey was administered at 44 colleges and universities representing a broad assortment of types of schools and representing all major regions of the country. At each school, the survey was administered to either all students or a random sample of students, and more than 27,000 students participated in the survey.
Step by Step Answer:

Statistics Unlocking The Power Of Data
ISBN: 9780470601877
1st Edition
Authors: Robin H. Lock, Patti Frazer Lock, Kari Lock Morgan, Eric F. Lock, Dennis F. Lock


