

Question: The latest US Census lists the average household size for all households in the US as 2.61. (A household is all people occupying a housing
The latest US Census lists the average household size for all households in the US as 2.61. (A household is all people occupying a housing unit as their primary place of residence.) Figure 3.6 shows possible distributions of means for 1000 samples of household sizes. The scale on the horizontal axis is the same in all four cases.
Figure 3.6
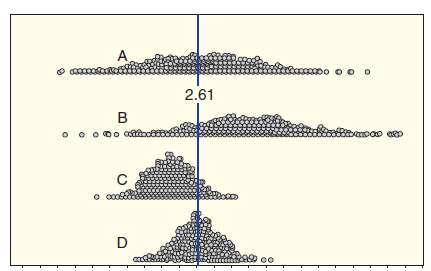 (a) Assume that two of the distributions show results from 1000 random samples, while two others show distributions from a sampling method that is biased. Which two dotplots appear to show samples produced using a biased sampling method? Explain your reasoning. Pick one of the distributions that you listed as biased and describe a sampling method that might produce this bias.
(b) For the two distributions that appear to show results from random samples, suppose that one comes from 1000 samples of size n = 100 and one comes from 1000 samples of size n = 500. Which distribution goes with which sample size? Explain.
coDo o o o 2.61 bd D
Step by Step Solution
3.35 Rating (167 Votes )
There are 3 Steps involved in it
a The two distributions centered at the population averag... View full answer

Get step-by-step solutions from verified subject matter experts