

Several of the models described in this chapter depend on estimates of average demand and average lead
Question:
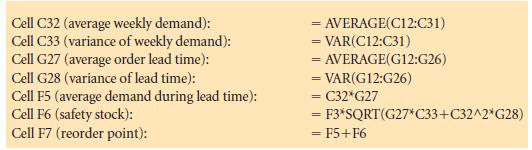
Several of the models described in this chapter depend on estimates of average demand and average lead time and on associated measures of variance (σ2) or standard deviation
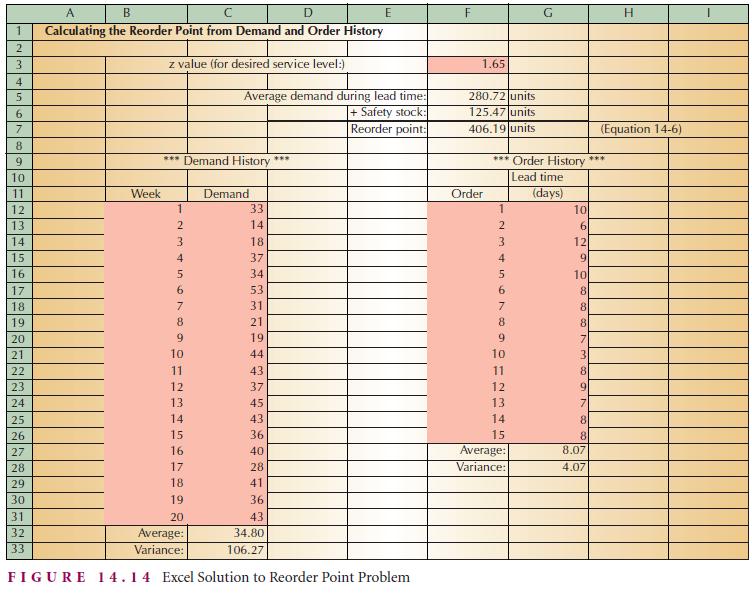
(σ). The spreadsheet model in Figure 14.14 shows how such values can be quickly estimated from historical data using Microsoft Excel’s built-in functions. The spreadsheet contains historical demand data for 20 weeks, as well as lead time information for 15 prior orders. From this information, the spreadsheet calculates average values and variances and then uses these values to calculate average demand during lead time, safety stock, and the reorder point. The highlighted cells represent the input values. The calculated cells are as follows:
Step by Step Answer:


Introduction To Operations And Supply Chain Management
ISBN: 9780131791039
2nd Edition
Authors: Cecil C. Bozarth, Robert B. Handfield
