

Using the following graph, complete the requirements. 1. Copy the graph and identify (label) fixed costs, variable
Question:
Using the following graph, complete the requirements.
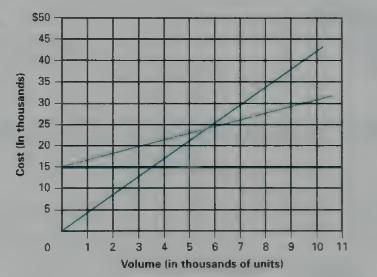
1. Copy the graph and identify (label) fixed costs, variable costs, total revenues, the total cost line, and the break-even point.
2. Determine the break-even point in both sales dollars and volume.
3. Suppose that as a manager you forecast sales volume at 7,000 units. At this level of sales, what would be your total fixed costs, approximate variable costs, and profit (or loss)?
4. At a sales volume of 3,000 units, what would be the level of fixed costs, variable costs, and approximate profit (or loss)?
Step by Step Answer:

This question has not been answered yet.
You can Ask your question!
Related Book For 
Survey Of Accounting
ISBN: 9780538846172
1st Edition
Authors: James D. Stice, W. Steve Albrecht, Earl Kay Stice, K. Fred Skousen
Question Posted:
