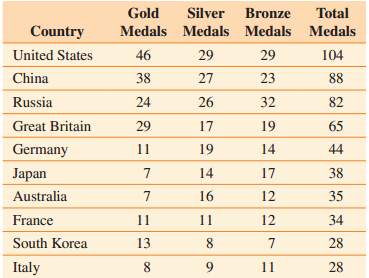
Consider the following table, which shows countries that won at least 25 medals in the 2012 Summer
Question:


Let A = set of countries that won at least 30 gold medals.
Let B = set of countries that won at least 15 silver medals.
Let C = set of countries that won at least 10 bronze medals.
Construct a Venn diagram that illustrates the sets A, B,and C.
Fantastic news! We've Found the answer you've been seeking!
Step by Step Answer:
Related Book For 

A Survey of Mathematics with Applications
ISBN: 978-0134112107
10th edition
Authors: Allen R. Angel, Christine D. Abbott, Dennis Runde
Question Posted:


