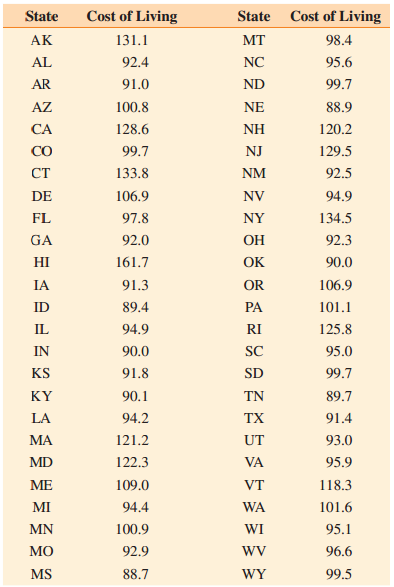
The data in the table indicate the cost of living in 2013, by state. The cost of
Question:
The data in the table indicate the cost of living in 2013, by state. The cost of living is a measure of the average price paid for housing, utilities, groceries, healthcare, transportation, and miscellaneous expenses. The national average cost of living is 100. The data can be used to compare a state to the national average and to other states.

Use these data to construct a frequency distribution with a first class of.
88.0–99.9
DistributionThe word "distribution" has several meanings in the financial world, most of them pertaining to the payment of assets from a fund, account, or individual security to an investor or beneficiary. Retirement account distributions are among the most...
Fantastic news! We've Found the answer you've been seeking!
Step by Step Answer:
Related Book For 

A Survey of Mathematics with Applications
ISBN: 978-0134112107
10th edition
Authors: Allen R. Angel, Christine D. Abbott, Dennis Runde
Question Posted:


