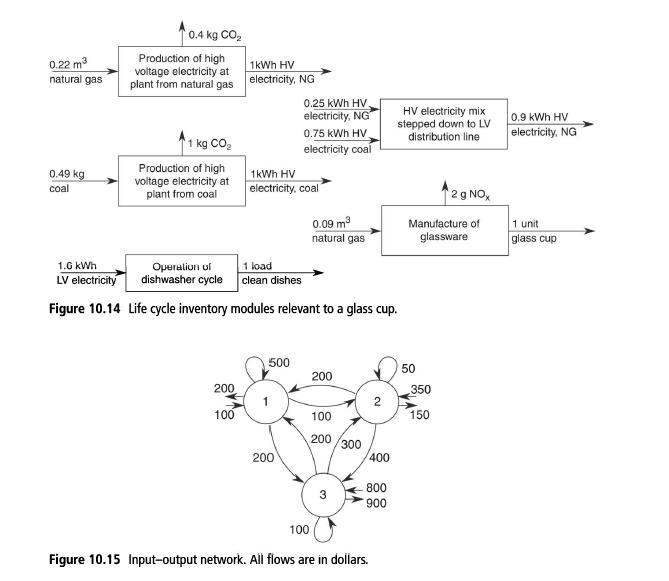
Consider the network shown in Figure 10.15. It consists of three sectors (nodes) and shows the monetary
Question:
Consider the network shown in Figure 10.15. It consists of three sectors (nodes) and shows the monetary exchange between the sectors. The final demand and value added flows are shown as flows to and from human resources. Assuming this diagram to represent a static snapshot of the network, answer the following questions.
1. Represent the network as an input-output table and find the total throughput r; for each sector.
2. Determine the input-output model relating the total throughput from each sector x; to the final demand fi. This will require you to find the appropriate coefficients, aij = xij/xj.
3. Use the model derived above to determine the throughput from each sector for final demands ƒ1 = $100, ƒ2 = $300,ƒ3 = $0.
4. From the results obtained in (3), prepare the corresponding network diagram or input-output table. You will need to show the monetary flows between all the sectors and human resources.

Step by Step Answer:

Sustainable Engineering Principles And Practice
ISBN: 9781108420457
1st Edition
Authors: Bhavik R. Bakshi


