

Question: Explain how the (f)-chart (Figure 7.32) can be used graphically to determine the solar load fraction for a range of collector sizes once the solar
Explain how the \(f\)-chart (Figure 7.32) can be used graphically to determine the solar load fraction for a range of collector sizes once the solar and loss parameters have been evaluated for only one system size. Consider a straight line passing through the origin and the point \(\left(P_{s}, P_{L}\right)\).
Figure 7.32
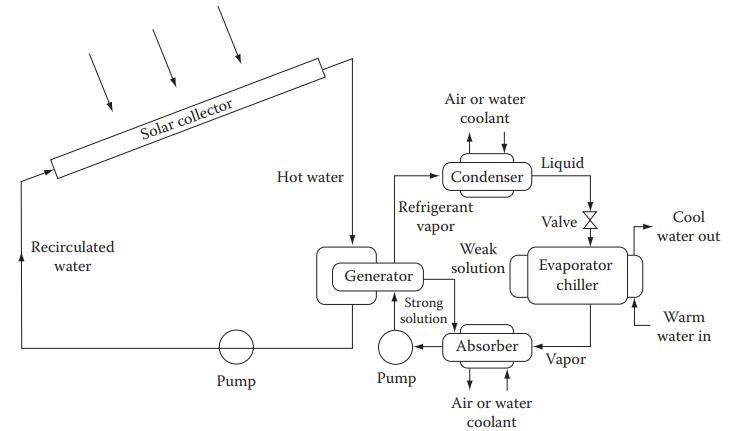
Recirculated water Solar collector Air or water coolant Liquid Hot water Condenser Refrigerant Valve vapor Cool water out Weak solution Generator Evaporator chiller Strong solution Pump Pump Air or water Warm water in Absorber Vapor coolant
Step by Step Solution
★★★★★
3.50 Rating (153 Votes )
There are 3 Steps involved in it
1 Expert Approved Answer
Step: 1 Unlock

Question Has Been Solved by an Expert!
Get step-by-step solutions from verified subject matter experts
Step: 2 Unlock
Step: 3 Unlock