

Question: a. Estimate the frequency of ringing in Figure 2.13b. DATA FROM FIGURE 2.13B b. Estimate the frequency of maximum peaking in Figure 2.14b, the corresponding
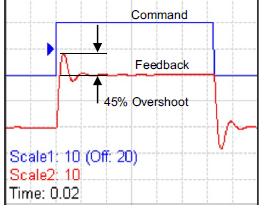
a. Estimate the frequency of ringing in Figure 2.13b.
DATA FROM FIGURE 2.13B
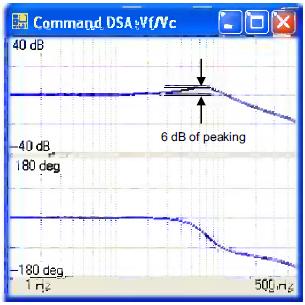
b. Estimate the frequency of maximum peaking in Figure 2.14b, the corresponding Bode plot.
DATA FROM FIGURE 2.14B
c. What conclusion do you draw by comparing a and b?
Command Feedback 45% Overshoot Scale1: 10 (Off: 20) Scale2: 10. Time: 0.02
Step by Step Solution
There are 3 Steps involved in it
1 Expert Approved Answer
Step: 1 Unlock

Question Has Been Solved by an Expert!
Get step-by-step solutions from verified subject matter experts
Step: 2 Unlock
Step: 3 Unlock