

Question: The following table gives data on normal time and cost, and crash time and cost for a project. (i) Draw the network and find out
The following table gives data on normal time and cost, and crash time and cost for a project.
(i) Draw the network and find out the critical path and the normal project duration.
(ii) Find out the total float associated with each activity.
(iii) If the indirect costs are Rs 100 per week, find out the optimum duration by crashing and the corresponding project costs.
(iv) With the crash duration indicated, what would be the minimum crash duration possible, ignoring indirect costs?
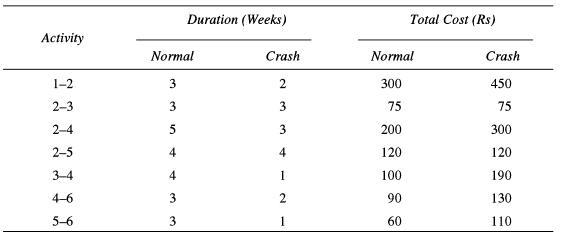
Duration (Weeks) Activity Normal Crash Normal Total Cost (Rs) Crash 1-2 3 2 300 450 2-3 3 3 75 75 2-4 5 3 200 300 2-5 4 4 120 120 3-4 4 1 100 190 4-6 3 2 90 130 5-6 3 1 60 110
Step by Step Solution
There are 3 Steps involved in it

Get step-by-step solutions from verified subject matter experts