

The following table describes a walk I recently took. I started at 1:30 and walked until 3:30:
Question:
The following table describes a walk I recently took. I started at 1:30 and walked until 3:30:
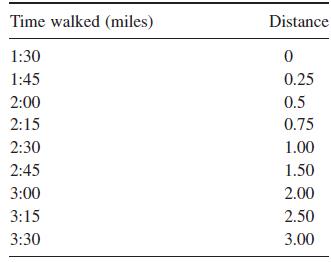
Draw a graph using time walking (in hours) as the horizontal axis and distance walked (in miles) as the vertical axis. What was my average speed for the entire walk? (Don ’ t forget to specify your units.) Can you estimate the instantaneous speeds near the beginning of the walk and near the end of the walk?
Step by Step Answer:

This question has not been answered yet.
You can Ask your question!
Related Book For 

Understanding The Mathematics Of Personal Finance An Introduction To Financial Literacy
ISBN: 9780470497807
1st Edition
Authors: Lawrence N. Dworsky
Question Posted:
