

Question: A mass is vibrating at the end of a spring of force constant 225 N/m. Figure E14.62 shows a graph of its position x as
A mass is vibrating at the end of a spring of force constant 225 N/m. Figure E14.62 shows a graph of its position x as a function of time t.
(a) At what times is the mass not moving?
(b) How much energy did this system originally contain?
(c) How much energy did the system lose between and t = 4.0 s? Where did this energy go?
Figure E14.62
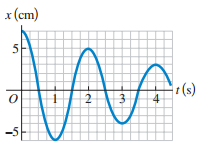
x (cm) 1 (s) -5
Step by Step Solution
★★★★★
3.56 Rating (163 Votes )
There are 3 Steps involved in it
1 Expert Approved Answer
Step: 1 Unlock

Identify The graph shows that the amplitude of vibration is decrea... View full answer
Question Has Been Solved by an Expert!
Get step-by-step solutions from verified subject matter experts
Step: 2 Unlock
Step: 3 Unlock
Document Format (2 attachments)
1477_605aea4ca5c3f_673785.pdf
180 KBs PDF File
1477_605aea4ca5c3f_673785.docx
120 KBs Word File