Question:
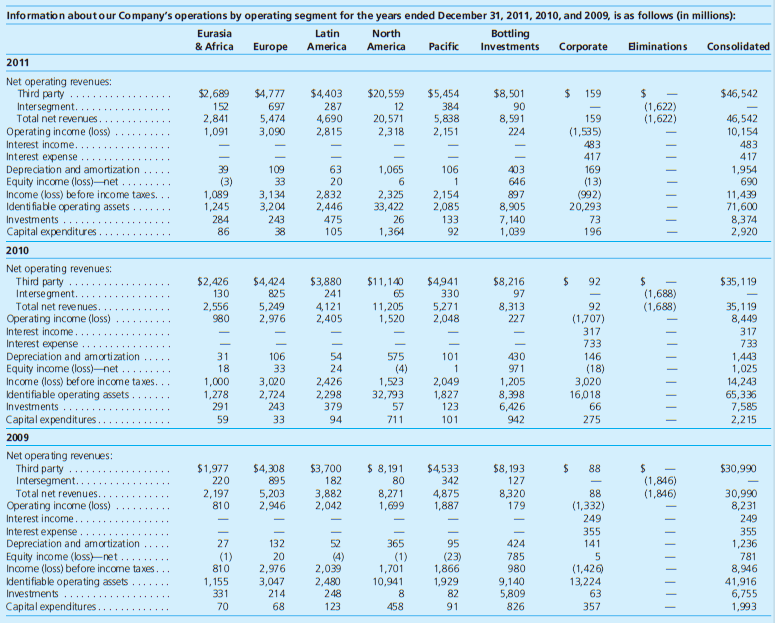
The Coca-Cola Company is organized geographically and defines reportable operating segments as regions of the world. The following information was extracted from Note 19 Operating Segments in the Coca-Cola Company 2011 Annual Report:


Required
1. Use an electronic spreadsheet to calculate the following measures for each of Coca-Cola's operating segments (excluding Bottling Investments and Corporate):
Percentage of total net revenues, 2010 and 2011
Percentage change in total net revenues, 2009 to 2010 and 2010 to 2011.
Operating income as a percentage of total net revenues (profit margin), 2010 and 2011
2. Determine whether you believe Coca-Cola should attempt to expand its operations in a particular region of the world to increase operating revenues and operating income.
3. List any additional information you would like to have to conduct your analysis.
Transcribed Image Text:
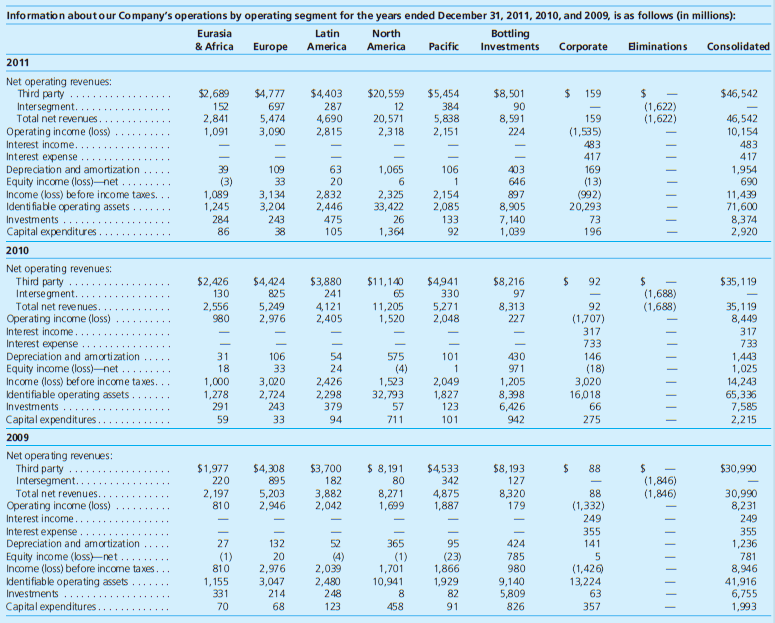
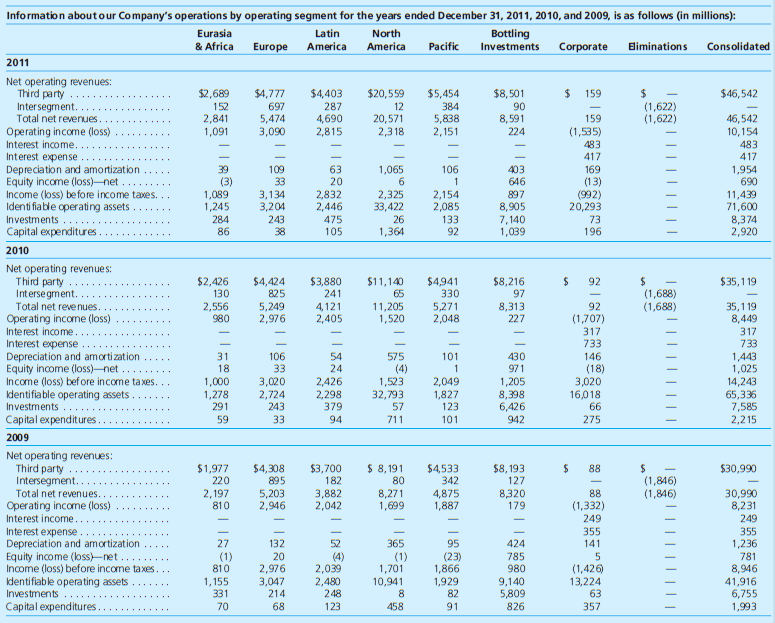
Information aboutour Company's operations by operating segment for the years ended December 31, 2011, 2010, and 2009, is as follows (in millions): Eurasia Latin North Bottling & Africa America America Pacific Bliminations Consolidated Europe Investments Corporate 2011 Net operating revenues: Third party Intersegment. Total net revenues. %24 (1,622) (1,622) $2,689 $4,777 697 5,474 3,090 $4,403 287 4,690 2,815 $20,559 12 20,571 $5,454 384 5,838 2,151 $8,501 90 8,591 224 24 159 $46, 542 152 2,841 1,091 159 46,542 10,154 Operating income (loss) Interest income. 2,3 18 (1,535) 483 483 417 Interest expense Depreciation and amortization Equity income (loss)-net. Income (loss) be fore income taxes. Identi fiable operating assets 417 39 (3) 1,089 1,245 284 86 63 20 2,832 2,446 1,065 106 403 169 (13) (992) 20,293 73 196 1,954 690 11,439 71,600 8,374 2,920 109 33 3,134 3,204 243 38 646 2,325 33,422 26 1,364 2,154 2,085 897 8,905 7,140 1,039 Investments 475 105 133 92 Capital expenditures .. 2010 Net operating revenues: Third party $2,426 130 2,556 980 $4,424 825 5,249 2,976 $3,880 241 4,121 2,405 $11,140 65 $4,941 330 5,271 2,048 $8,216 97 8,313 227 92 $35,119 (1,688) (1,688) Intersegment. Total net revenues. Operating income (loss) Interest income. Interest expense Depreciation and amortization Equity income (loss)-net Income (loss) bef ore income taxes. kdentifiable operating assets. Investments .. 11,205 1,520 35,1 19 8,449 317 733 92 (1,707) 317 733 146 (18) 3,020 16,018 66 275 31 106 33 101 430 971 1,443 1,025 14,243 65,336 7,585 2,215 54 24 575 (4) 1,523 32,793 18 3,020 2,724 243 33 2,426 2,298 379 94 2,049 1,827 123 1,205 8,398 6,426 942 1,000 1,278 291 57 Capital expenditures. 59 101 711 2009 Net opera ting revenues: Third party Intersegment.. Total net revenues. $ 8, 191 80 $1,977 220 2,197 810 $4,308 895 5,203 2,946 $3,700 182 $4,533 342 $8, 193 127 $30,990 88 (1,846) (1,846) 3,882 2,042 8,271 1,699 4,875 1,887 8,320 179 30,990 8,231 249 355 1,236 88 (1,332) 249 355 Operating income (loss) Interest income.. Interest expense. Depreciation and amortization Equity income (loss)-net .. Income (loss) before income taxes. kdentifiable operating assets Investments 27 132 20 2,976 3,047 214 52 365 95 424 141 (4) 2,039 2,480 248 (1) 1,701 10,941 8. (23) 1,866 1,929 82 785 980 9,140 5,809 826 (1) 781 (1,426) 13,224 63 357 8,946 810 1,155 331 70 41,916 6,755 1,993 Capital expenditures. 68 123 91 458 |||||| || |||||||| || || || || | |


