

Question: The data shown in the Table 8E.8 were collected in an experiment to optimize crystal growth as a function of three variables . Large values
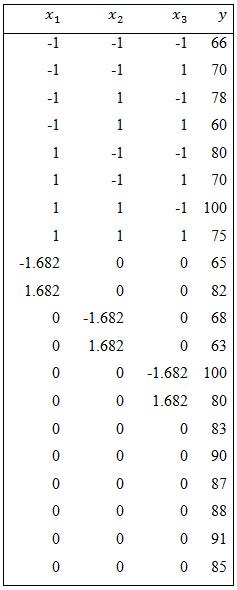
The data shown in the Table 8E.8 were collected in an experiment to optimize crystal growth as a function of three variables  . Large values of y (yield in grams) are desirable. Fit a second-order model and analyze the fitted surface. Under what set up conditions is maximum growth achieved?
X1,X2, andx, 3.
Step by Step Solution
★★★★★
3.47 Rating (170 Votes )
There are 3 Steps involved in it
1 Expert Approved Answer
Step: 1 Unlock

Select Stat DOE Response Surface Create Response Surface Design Change to a 3 factor central composi... View full answer
Question Has Been Solved by an Expert!
Get step-by-step solutions from verified subject matter experts
Step: 2 Unlock
Step: 3 Unlock
Document Format (1 attachment)
552-M-S-Q-C-B-S (431).docx
120 KBs Word File