

Question: The diagram below shows three continuous stirred tanks connected in series. The flow and mixing patterns in this system arc studied by dissolving 1500 g
The diagram below shows three continuous stirred tanks connected in series. The flow and mixing patterns in this system arc studied by dissolving 1500 g of a salt (S) in the first tank, filling each of the other two tanks with pure solvent, and then starting the 40L/s flow through the system. Each tank outlet stream is monitored with an on-line thermal conductivity detector calibrated to provide instantaneous readings of salt Concentration. The data are plotted versus time and the results are compared with the plots that would be expected if the tanks are all perfectly mixed. Your job is to generate the latter plots.
(a) Assuming that pure solvent is fed to the first tank and that each tank is perfectly mixed (so that the salt concentration in a tank is uniform and equal to the concentration in the outlet stream from that tank), write salt balances on each of the three tanks, convert them to expressions for dCS1/dt, dC S2/dt, and dCS3/dt, and provide appropriate initial conditions.
(b) Without doing any calculations, on a single graph sketch the forms of the plots of CS1 versus t, CS2 versus t, and CS3 versus t you would expect to obtain. Briefly explain your reasoning.
(c) Use a differential equation-solving program to solve the three equations, proceeding to a time at which CS3 has fallen below 0.01g/L, and plot theresults.
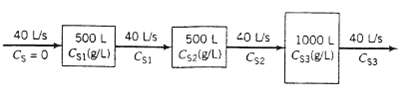
40 L/s 500 L Cs=0 Cs1(8/L) 40 L/s CS1 500 L Cs2(g/L) 40 U/s CS2 1000 L Cs3(g/L) 40 U/s C53
Step by Step Solution
3.34 Rating (169 Votes )
There are 3 Steps involved in it
a Salt Balance on the 1st tank AccumulationOutput dCsiVCv dCs1C517 C1 V 008CS1 dt Cs1015005003 gL dt ... View full answer

Get step-by-step solutions from verified subject matter experts
Document Format (1 attachment)
13-E-C-E-C-P (613).docx
120 KBs Word File