

Question: The following data give the amounts (in dollars) spent on refreshments by 30 spectators randomly selected from those who patronized the concession stands at a
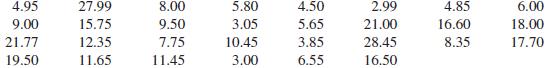
The following data give the amounts (in dollars) spent on refreshments by 30 spectators randomly selected from those who patronized the concession stands at a recent Major League Baseball game.
a. Construct a frequency distribution table using the less-than method to write classes. Take $0 as the lower boundary of the first class and $6 as the width of each class.
b. Calculate the relative frequencies and percentages for all classes.
c. Draw a histogram for the frequency distribution.
4.95 9.00 21.77 19.50 27.99 15.75 12.35 11.65 8.00 9.50 7.75 11.45 2 4.50 5.65 3.85 6.55 2.99 3.05 10.45 3.00 4.85 16.60 8.35 1 28.45 16.50 18.00 17.70
Step by Step Solution
3.34 Rating (181 Votes )
There are 3 Steps involved in it
a and b Concession dollars Frequency Relative Frequenc... View full answer

Get step-by-step solutions from verified subject matter experts
Document Format (1 attachment)
492-M-S-D-A (3189).docx
120 KBs Word File