

Question: The following data give the repair costs (in dollars) for 30 cars randomly selected from a list of cars that were involved in collisions. a.
The following data give the repair costs (in dollars) for 30 cars randomly selected from a list of cars that were involved in collisions.
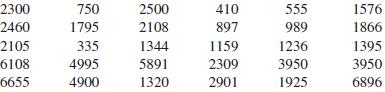
a. Construct a frequency distribution table. Take $1 as the lower limit of the first class and $1400 as the width of each class.
b. Compute the relative frequencies and percentages for all classes.
c. Draw a histogram and a polygon for the relative frequency distribution.
d. What are the class boundaries and the width of the fourth class?
750 1795 335 4995 4900 2500 2108 1344 5891 1320 410 1576 1866 1395 2300 5 989 1236 3950 1925 2 2105 6108 6655 1159 2309 2 6896
Step by Step Solution
3.36 Rating (168 Votes )
There are 3 Steps involved in it
a and b Car Repair Costs dollars Frequency Relative Frequency Percentage 1 ... View full answer

Get step-by-step solutions from verified subject matter experts
Document Format (1 attachment)
492-M-S-D-A (3190).docx
120 KBs Word File