

Question: Using the y-x and T-y-x diagrams in Figures 4.3 and 4.4, determine the temperature, amounts, and compositions of the equilibrium vapor and liquid phases at
Using the y-x and T-y-x diagrams in Figures 4.3 and 4.4, determine the temperature, amounts, and compositions of the equilibrium vapor and liquid phases at 101 kPa for the following conditions with a 100-kmol mixture of nC6 (H) and nC8 (C).(a) ZH = 0.5, ? = V/F = 0.2(b) ZH = 0.4, yH = 0.6(c) ZH = 0.6, xc = 0.7(d) ZH = 0.5, ? = 0(e) ZH = 0.5, ? = 1.0(f) ZH = 0.5, T = 200?F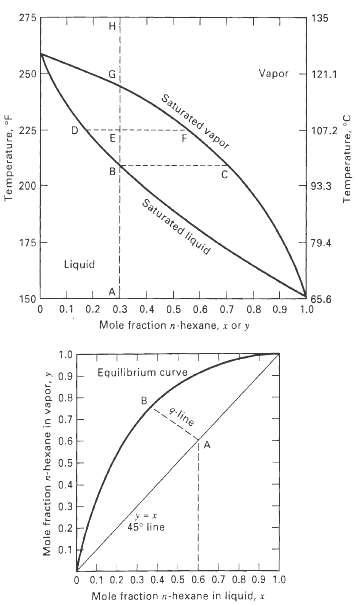
135 275 121.1 Vapor 250 Saturated vapor 107.2 225 B. 93.3 200 Saturated liquid 79.4 175 Liquid 65.6 1.0 0.8 0.9 150 0.2 0.3 0.4 0.5 0.6 0.7 0.1 n hexane, x or y Mole fraction 1.0 Equilibrium curve 0.9 0.8 q-line 0.7- 0.6 0.5 0.4- 0.3 45 line 0.2 0.1 0 0.1 0.2 0.3 0.4 0.5 0.6 0.7 0.8 0.9 1.0 Mole fraction n-hexane in liquid, x Temperature, F Mole fraction n-hexane in vapor, y Temperature, C
Step by Step Solution
3.51 Rating (164 Votes )
There are 3 Steps involved in it
Let z H mole fraction of nhexane in the feed and VF Use inverse leverarm ... View full answer

Get step-by-step solutions from verified subject matter experts
Document Format (1 attachment)
37-E-C-E-S-P (105).docx
120 KBs Word File