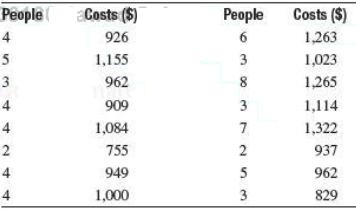
A marketing research firm would like to display the relationship between a familys weekly food costs and
Question:
A marketing research firm would like to display the relationship between a family’s weekly food costs and the number of family members living in the household. The following table shows the monthly food costs and the number of family members for 16 families. These data can also be found in Excel file food costs. xlsx.

Fantastic news! We've Found the answer you've been seeking!
Step by Step Answer:
Related Book For 

Question Posted:


