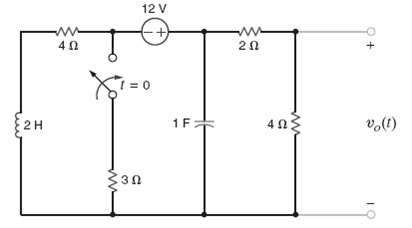
Question: For the network shown in figure use PSPICE to plot vo(t) over a 10-sec interval starting at t = 0 using a 100-ms step size.
For the network shown in figure use PSPICE to plot vo(t) over a 10-sec interval starting at t = 0 using a 100-ms step size.

12 V 2H 1F: vo(1) 403 330
Step by Step Solution
3.28 Rating (177 Votes )
There are 3 Steps involved in it
m R 4 11 2 H 12 V Szo R312 un R xi 0 1 F Initial ... View full answer

Get step-by-step solutions from verified subject matter experts
Document Format (1 attachment)
27-E-E-C-A (1533).docx
120 KBs Word File


