

Question: Make two schematic plots of the logarithm of relaxation modulus versus temperature for an amorphous polymer (curve C in Figure). (a) On one of these
Make two schematic plots of the logarithm of relaxation modulus versus temperature for an amorphous polymer (curve C in Figure).
(a) On one of these plots demonstrate how the behavior changes with increasing molecular weight.
(b) On the other plot, indicate the change in behavior with increasing cross linking.
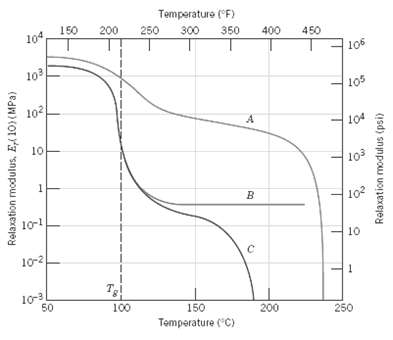
Temperature (F) 150 200 104 250 300 350 400 450 105 103 105 102 104 10 103 102 10-1 10 10-2 10 50 100 150 200 250 Temperature ("C) Relaxation modulus, E, 10)(MPa) (sd) snjnpow uOexejey
Step by Step Solution
3.29 Rating (167 Votes )
There are 3 Steps involved in it
a This portion of the problem calls for a plot of log E r 1... View full answer

Get step-by-step solutions from verified subject matter experts
Document Format (1 attachment)
33-E-M-S-E-M-S (569).docx
120 KBs Word File