

Question: Table 3.1 in the last chapter presents R&E Supplies financial statements for the period 2014 through 2017, and Table 3.5 presents a pro forma financial
Table 3.1 in the last chapter presents R&E Supplies’ financial statements for the period 2014 through 2017, and Table 3.5 presents a pro forma financial forecast for 2018. Use the information in these tables to answer the following questions.
a. Calculate R&E’s sustainable growth rate in each year from 2015 through 2018.
b. Comparing the company’s sustainable growth rate with its actual and projected growth rates in sales over these years, what growth management problems does R&E appear to face in this period?
c. How did the company cope with these problems? Do you see any difficulties with the way it addressed its growth problems over this period? If so, what are they?
d. What advice would you offer management regarding managing future growth?
Table 3.1
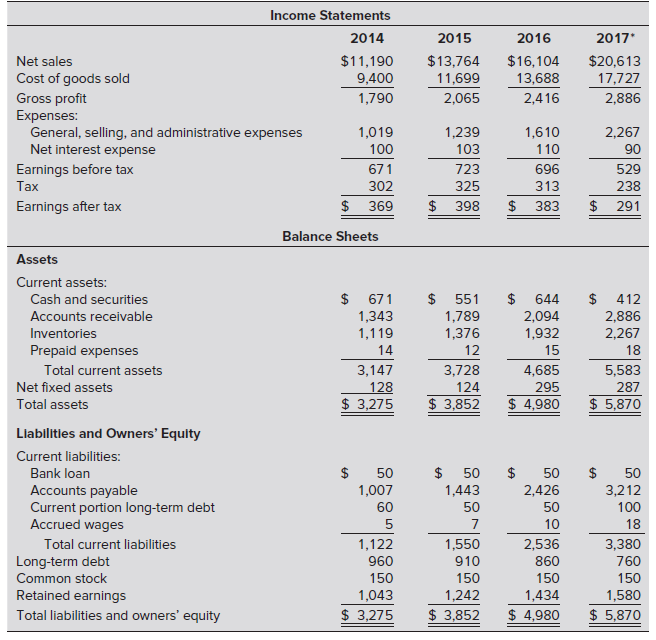
Income Statements 2014 2015 2016 2017* Net sales $11,190 9,400 $13,764 11,699 $16,104 $20,613 17,727 Cost of goods sold 13,688 Gross profit Expenses: General, selling, and administrative expenses Net interest expense 1,790 2,065 2,416 2,886 1,610 1,019 1,239 2,267 100 103 110 90 Earnings before tax 723 671 696 529 302 313 238 Tax 325 $ 369 Earnings after tax 398 383 291 Balance Sheets Assets Current assets: $ 671 $ 551 1,789 1,376 644 Cash and securities 412 Accounts receivable 1,343 2,094 1,932 2,886 2,267 Inventories 1,119 Prepaid expenses 14 12 15 18 Total current assets 3,147 3,728 4,685 295 5,583 Net fixed assets 128 $ 3,275 124 287 $ 5,870 $ 3,852 $ 4,980 Total assets Llabilitles and Owners' Equity Current liabilities: $ 50 1,443 Bank loan 50 50 50 Accounts payable Current portion long-term debt Accrued wages 1,007 2,426 3,212 60 50 50 100 18 10 3,380 Total current liabilities 1,122 1,550 2,536 Long-term debt Common stock Retained earnings 960 910 860 760 150 150 150 150 1,043 1,242 1,434 1,580 $ 5,870 $ 3,275 $ 3,852 $ 4,980 Total liabilities and owners' equity
Step by Step Solution
3.38 Rating (167 Votes )
There are 3 Steps involved in it
a RE Supplies Inc Sustainable Growth Calculations 2014 2015 2016 2017 2018F Profit margin P 33 29 24 ... View full answer

Get step-by-step solutions from verified subject matter experts