

Question: Aiming to compare the average service times in two bank branches, data on 22 clients from each bank branch were collected, as shown in the
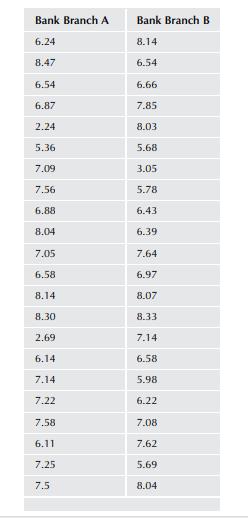
Aiming to compare the average service times in two bank branches, data on 22 clients from each bank branch were collected, as shown in the table. Use the most suitable test, with a significance level of 5%, to test whether both samples come or do not come from populations with the same medians.
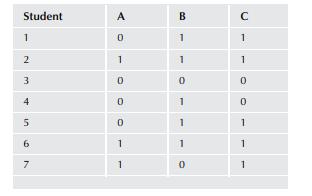
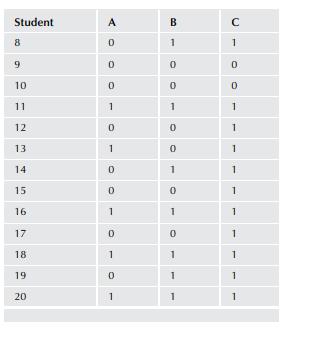
(9) A group of 20 Business Administration students evaluated their level of learning based on three subjects studied in the field of Applied Quantitative Methods, by answering if their level of learning was high (1) or low (0). The results can be seen in the table. Check and see if the proportion of students with a high level of learning is the same for each subject. Consider a significance level of 2.5%.
Bank Branch A Bank Branch B 6.24 8.14 8.47 6.54 6.54 6.66 6.87 7.85 2.24 8.03 5.36 5.68 7.09 3.05 7.56 5.78 6.88 6.43 8.04 6.39 7.05 7.64 6.58 6.97 8.14 8.07 8.30 8.33 2.69 7.14 6.14 6.58 7.14 5.98 7.22 6.22 7.58 7.08 6.11 7.62 7.25 5.69 7.5 8.04
Step by Step Solution
There are 3 Steps involved in it

Get step-by-step solutions from verified subject matter experts