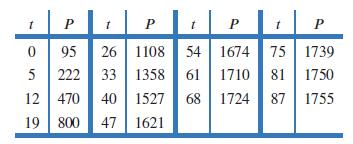
In the spring of 2003, SARS (Severe Acute Respiratory Syndrome) spread rapidly in several Asian countries and
Question:
In the spring of 2003, SARS (Severe Acute Respiratory Syndrome) spread rapidly in several Asian countries and Canada. Table 4.9 gives the total number, P, of SARS cases reported in Hong Kong by day t, where t = 0 is March 17, 2003.(a) Find the average rate of change of P for each interval in Table 4.9.
 (b) In early April 2003, there was fear that the disease would spread at an ever-increasing rate for a long time. What is the earliest date by which epidemiologists had evidence to indicate that the rate of new cases had begun to slow?(c) Explain why an exponential model for P is not appropriate.(d) It turns out that a logistic model fits the data well. Estimate the value of t at the inflection point. What limiting value of P does this point predict?(e) The best-fitting logistic function for this data turns out to be

What limiting value of P does this function predict?
Step by Step Answer:

Applied Calculus
ISBN: 9781119275565
6th Edition
Authors: Deborah Hughes Hallett, Patti Frazer Lock, Andrew M. Gleason, Daniel E. Flath, Sheldon P. Gordon, David O. Lomen, David Lovelock, William G. McCallum, Brad G. Osgood, Andrew Pasquale


