

Question: An article in Nature Genetics [Treatment-specifi c Changes in Gene Expression Discriminate in Vivo Drug Response in Human Leukemia Cells (2003, Vol. 34(1), pp. 8590)]
An article in Nature Genetics [€œTreatment-specifi c Changes in Gene Expression Discriminate in Vivo Drug Response in Human Leukemia Cells€ (2003, Vol. 34(1), pp. 85€“90)] studied gene expression as a function of treatments for leukemia. One group received a high dose of the drug, while the control group received no treatment. Expression data (measures of gene activity) from one gene are shown in Table 6E.1. Construct a box plot for each group of patients. Write an interpretation to compare the information in these plots.
Table 6e.1
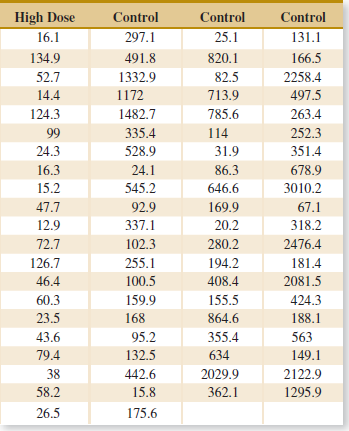
High Dose 16.1 Control Control Control 25.1 297.1 131.1 820.1 134.9 491.8 166.5 52.7 1332.9 82.5 2258.4 1172 14.4 713.9 497.5 785.6 124.3 1482.7 263.4 99 335.4 114 252.3 528.9 24.3 31.9 351.4 16.3 24.1 86.3 678.9 15.2 646.6 545.2 3010.2 92.9 169.9 47.7 67.1 20.2 12.9 337.1 318.2 72.7 102.3 280.2 2476.4 126.7 255.1 194.2 181.4 2081.5 46.4 100.5 408.4 155.5 424.3 60.3 159.9 23.5 168 864.6 188.1 43.6 95.2 355.4 563 79.4 132.5 634 149.1 2122.9 38 442.6 2029.9 58.2 1295.9 15.8 362.1 26.5 175.6
Step by Step Solution
3.32 Rating (167 Votes )
There are 3 Steps involved in it
All distributions are centered at about ... View full answer

Get step-by-step solutions from verified subject matter experts