

Question: Consider an EMWA control chart. The target value for the process is μ 0 = 50 and Ï = 2. Use Table 15-11. (a) If
(a) If the sample size is n = 1, would you prefer an EWMA chart with λ = 0.1 and L = 2.81 or λ = 0.5 and L = 3.07 to detect a shift in the process mean to μ = 52 on average? Why?
(b) If the sample size is increased to n = 4, which chart in part (a) do you prefer? Why?
(c) If an EWMA chart with λ = 0.1 and L = 2.81 is used, what sample size is needed to detect a shift to μ = 52 in approximately three samples on average?
Table 15-11
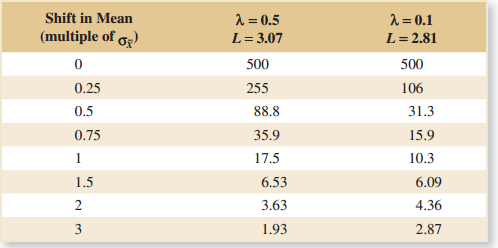
2 = 0.1 2 = 0.5 Shift in Mean (multiple of ) L= 3.07 L= 2.81 500 500 0.25 255 106 0.5 88.8 31.3 15.9 0.75 35.9 1 17.5 10.3 6.53 1.5 6.09 3.63 4.36 3 1.93 2.87
Step by Step Solution
3.53 Rating (163 Votes )
There are 3 Steps involved in it
a The shift of the mean is 1 So we prefer 001 and L281 beca... View full answer

Get step-by-step solutions from verified subject matter experts