

Question: NP Control Chart. An alternative to the control chart for fraction defective is a control chart based on the number of defectives or the NP
NP Control Chart. An alternative to the control chart for fraction defective is a control chart based on the number of defectives or the NP control chart. The chart has center line at np̅, the control limits are
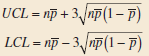
and the number of defectives for each sample is plotted on the chart.
(a) Verify that the control limits provided are correct.
(b) Apply this control, chart to the data in Example 15-4.
(c) Will this chart always provide results that are equivalent to the usual P chart?
Example 15-4
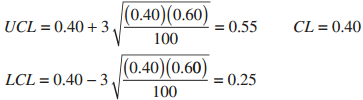
We wish to construct a fraction-defective control chart for a ceramic substrate production line. We have 20 preliminary samples, each of size 100; the number of defectives in each sample is shown in Table 15-5. Assume that the samples are numbered in the sequence of production. Note that p¯= (800 / 2000) = 0.40; therefore, the trial parameters for the control chart are
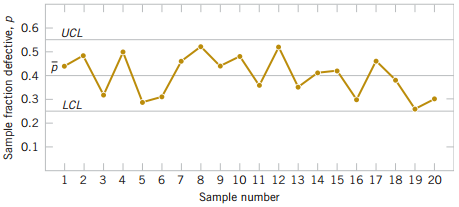
The control chart is shown in Fig. 15-16. All samples are in control. If they were not, we would search for assignable causes of variation and revise the limits accordingly. This chart can be used for controlling future production.
Practical Interpretation: Although this process exhibits statistical control, its defective rate (p¯= 0.40) is very poor. We should take appropriate steps to investigate the process to determine why such a large number of defective units is being produced. Defective units should be analyzed to determine the specific types of defects present. Once the defect types are known, process changes should be investigated to determine their impact on defect levels. Designed experiments may be useful in this regard.
Table 15.5
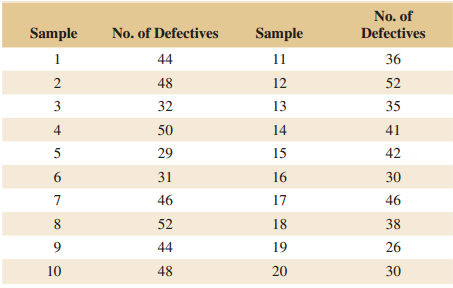
Figure 15-16
Step by Step Solution
There are 3 Steps involved in it
a Let X denote the number of defectives in a sample of n Then X has a bino... View full answer

Get step-by-step solutions from verified subject matter experts