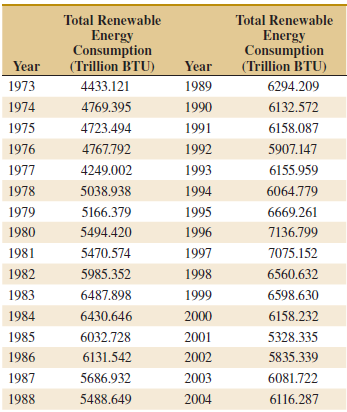
The following data from the U.S. Department of Energy Web site (www.eia.doe.gov) reported the total U.S. renewable
Question:

(a) Using all the data, find calculate control limits for a control chart for individual measurements, construct the chart, and plot the data.
(b) Do the data appear to be generated from an in-control process? Comment on any patterns on the chart.
Fantastic news! We've Found the answer you've been seeking!
Step by Step Answer:
Related Book For 

Applied Statistics And Probability For Engineers
ISBN: 9781118539712
6th Edition
Authors: Douglas C. Montgomery, George C. Runger
Question Posted:


