

The following performance measurement data pertains to two systems, A and B: Required: Draw Gantt charts and
Question:
The following performance measurement data pertains to two systems, A and B:
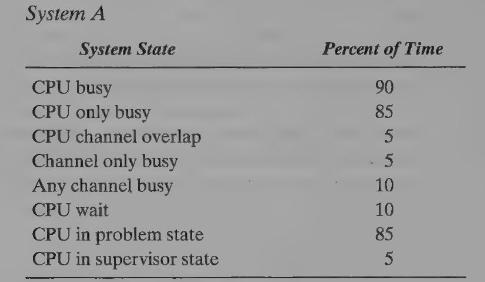
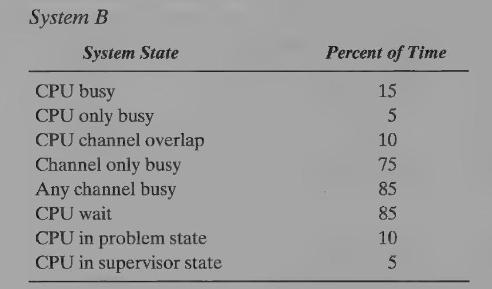
Required: Draw Gantt charts and Kiviat graphs to show the performance measurement data for the two systems. What conclusions would you reach about the two systems on the basis of the data you have displayed graphically? How are they similar? How are they different?
Step by Step Answer:

This question has not been answered yet.
You can Ask your question!
Related Book For 

Question Posted:
