Table 2.24 shows the number of women (per 1000) between 15 and 50 years of age who
Question:
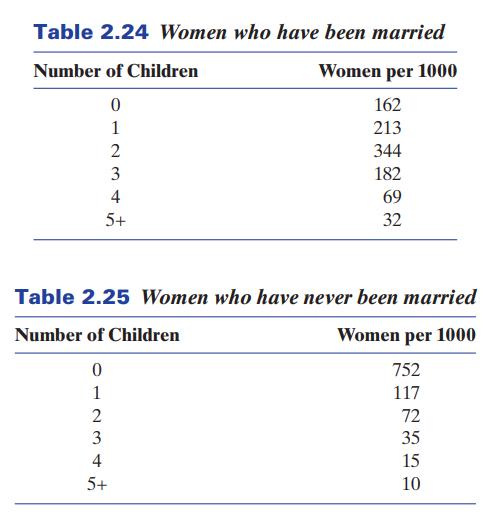
Table 2.24 shows the number of women (per 1000) between 15 and 50 years of age who have been married grouped by the number of children they have had. Table 2.25 gives the same information for women who have never been married.

(a) Without doing any calculations, which of the two samples appears to have the highest mean number of children? Which of the distributions appears to have the mean most different from the median? Why?
(b) Find the median for each dataset.
Transcribed Image Text:
Table 2.24 Women who have been married Number of Children Women per 1000 0 162 1 213 2 344 182 3 4 5+ 69 32 Table 2.25 Women who have never been married Number of Children Women per 1000 0 752 1 117 72 35 2 3 4 5+ 15 10
Fantastic news! We've Found the answer you've been seeking!
Step by Step Answer:
Answer rating: 50% (2 reviews)
a It appears that the mean of the married women is higher than ...View the full answer

Answered By

Akshay Singla
as a qualified engineering expert i am able to offer you my extensive knowledge with real solutions in regards to planning and practices in this field. i am able to assist you from the beginning of your projects, quizzes, exams, reports, etc. i provide detailed and accurate solutions.
i have solved many difficult problems and their results are extremely good and satisfactory.
i am an expert who can provide assistance in task of all topics from basic level to advance research level. i am working as a part time lecturer at university level in renowned institute. i usually design the coursework in my specified topics. i have an experience of more than 5 years in research.
i have been awarded with the state awards in doing research in the fields of science and technology.
recently i have built the prototype of a plane which is carefully made after analyzing all the laws and principles involved in flying and its function.
1. bachelor of technology in mechanical engineering from indian institute of technology (iit)
2. award of excellence in completing course in autocad, engineering drawing, report writing, etc
4.70+
48+ Reviews
56+ Question Solved
Related Book For 

Statistics Unlocking The Power Of Data
ISBN: 9781119682219
3rd Edition
Authors: Robin H Lock, Patti Frazer Lock, Kari Lock Morgan, Eric F Lock, Dennis F Lock
Question Posted:
Students also viewed these Statistics questions
-
Table 2.18 shows the number of women (per 1000) between 15 and 44 years of age who have been married grouped by the number of children they have had. Table 2.19 gives the same information for women...
-
1. How strong are the competitive forces confronting J. Crew in the market for specialty retail? Do a [Michael Porter] five-forces analysis to support your answer. (see chapter 3 in the textfor...
-
The Crazy Eddie fraud may appear smaller and gentler than the massive billion-dollar frauds exposed in recent times, such as Bernie Madoffs Ponzi scheme, frauds in the subprime mortgage market, the...
-
a) What would be the third term? What would be the next to last term? What would be the last term? b) What would be the second term? What would be the next to last term? What would be the last term?...
-
Paul and Maria want to have enough money to travel around the world when they retire. They both just turned 30 and will retire when they turn 60. They earn a total of $9,000 after taxes each month....
-
on January 1, 20x1 entitiy A acquires 30% interest in Entity B for 600,000. Entity B reports profit of 200,000 and declares dividends of 50,000 in 20x1. How much is the carrying amount of the...
-
Consider two situations: one in which information technology helped you build a relationship, and one in which it inhibited the development of a relationship. How did technology help in the first...
-
Listed below are three lottery payout options. Option 1: $ 975,000 now Option 2: $ 153,000 at the end of each year for the next nine years Option 3: $ 1,550,000 nine years from now Rather than...
-
Cone Corporation is in the process of preparing its December 31, 2021, balance sheet. There are some questions as to the proper classification of the following items: $50,000 in cash restricted in a...
-
a) Draw in the location of the North Celestial Pole. Note that since this location is directly above the Earth's North Pole it will not move in the sky as Earth rotates. b) Draw in star A at the...
-
Does cuddling after sex help boost sexual and relationship satisfaction? A study involving 335 participants involved in romantic relationships found that people who reported more time spent on...
-
Give the relevant proportion using correct notation. A survey conducted of 1060 randomly selected US teens aged 13 to 17 found that 605 of them say they have made a new friend online.
-
Which of the following was not cited as an advantage of working in a home office? a. flexibility in scheduling b. low overhead expenses c. no commute time d. no interruptions
-
Write a program that solves either a) the Towers of Hanoi problem with up to 1000 disks, or, b) the Traveling Salesman problem with up to 10 cities. You may need to wait until you have read about...
-
Consider the E-R diagram in Figure 8-15b. a. What would be the identifier for the CERTIFICATE associative entity if Certificate Number were not included? b. Now assume that the same employee may take...
-
z = 1.1 for H a : < 149.6 Find the P-value that corresponds to the standard z-score, and determine whether the alternative hypothesis is supported at the 0.05 significance level.
-
An object is placed \(150 \mathrm{~mm}\) away from a converging thin lens that has a focal length of \(400 \mathrm{~mm}\). What are (a) the image distance and \((b)\) the magnification? (c) Draw a...
-
Let $M$ be the four-dimensional Minkowski space, with coordinates $x^{0}, x^{1}, x^{2}$, and $x^{3}$. Let us define a linear operator $*: \Omega^{r}(M) ightarrow$ $\Omega^{4-r}(M)$, such that...
-
Define three-dimensional concurrent engineering.
-
Write a paper about the Working relationship in the organization- collaboration within and outside the organization
-
Is there a sprinting gene? We describe data collection methods. Indicate whether the data come from an experiment or an observational study.
-
Are there human pheromones? Introduced. Three studies are described; indicate whether each of them is an experiment or an observational study. We describe data collection methods. Indicate whether...
-
Three situations are described at the start of this section. In the second bullet, we describe an association between activity at a buildings heating plant and more employees missing work due to back...
-
A project will generate annual cash flows of $237,600 for each of the next three years, and a cash flow of $274,800 during the fourth year. The initial cost of the project is $749,600. What is the...
-
You want to invest annual amounts over the next 15 years. If your goal is to have $15,000 at the end of that time and if you can earn 8 percent on your invested funds, how much do you need to invest...
-
please explain thoroughly how to do in excel 1. Find the number of units to ship from each factory to each customer that minimizes total cost

Study smarter with the SolutionInn App


