Body Temperatures Based on Data Set 2 Body Temperatures in Appendix B, body temperatures of adults have
Question:
Body Temperatures Based on Data Set 2 “Body Temperatures” in Appendix B, body temperatures of adults have a mean of 98.20oF and a standard deviation of 0.62oF. Is an adult body temperature of 100oF significantly low or significantly high?
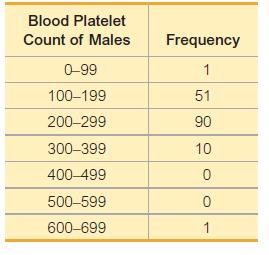
33. In Exercises 33 and 34, refer to the frequency distribution in the given exercise and find the standard deviation by using the formula below, where x represents the class midpoint, f represents the class frequency, and n represents the total number of sample values. Also, compare the computed standard deviations to these standard deviations obtained by using Formula 3-4 with the original list of data values: (Exercise 33) 59.5; (Exercise 34) 65.4.

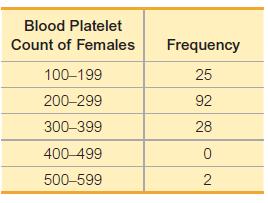
34. In Exercises 33 and 34, refer to the frequency distribution in the given exercise and find the standard deviation by using the formula below, where x represents the class midpoint, f represents the class frequency, and n represents the total number of sample values. Also, compare the computed standard deviations to these standard deviations obtained by using Formula 3-4 with the original list of data values: (Exercise 33) 59.5; (Exercise 34) 65.4.

35. Why Divide by n 1? Let a population consist of these values: 9 cigarettes, 10 cigarettes, and 20 cigarettes smoked in a day (based on data from the California Health Interview Survey). Assume that samples of two values are randomly selected with replacement from this population. (That is, a selected value is replaced before the second selection is made.)
a. Find the variance s2 of the population {9 cigarettes, 10 cigarettes, 20 cigarettes}.
b. After listing the nine different possible samples of two values selected with replacement, find the sample variance s2 (which includes division by n - 1) for each of them; then find the mean of the nine sample variances s2.
c. For each of the nine different possible samples of two values selected with replacement, find the variance by treating each sample as if it is a population (using the formula for population variance, which includes division by n); then find the mean of those nine population variances.
d. Which approach results in values that are better estimates of s2: part
(b) or part (c)? Why?
When computing variances of samples, should you use division by n or n - 1?
e. The preceding parts show that s2 is an unbiased estimator of s2. Is s an unbiased estimator of s? Explain.
36. Mean Absolute Deviation Use the same population of {9 cigarettes, 10 cigarettes, 20 cigarettes} from Exercise 35. Show that when samples of size 2 are randomly selected with replacement, the samples have mean absolute deviations that do not center about the value of the mean absolute deviation of the population. What does this indicate about a sample mean absolute deviation being used as an estimator of the mean absolute deviation of a population?
Step by Step Answer:

Biostatistics For The Biological And Health Sciences
ISBN: 9780134039015
2nd Edition
Authors: Marc Triola, Mario Triola, Jason Roy


