All Matches
Solution Library
Expert Answer
Textbooks
Search Textbook questions, tutors and Books
Oops, something went wrong!
Change your search query and then try again
Toggle navigation
FREE Trial
S
Books
FREE
Tutors
Study Help
Expert Questions
Accounting
General Management
Mathematics
Finance
Organizational Behaviour
Law
Physics
Operating System
Management Leadership
Sociology
Programming
Marketing
Database
Computer Network
Economics
Textbooks Solutions
Accounting
Managerial Accounting
Management Leadership
Cost Accounting
Statistics
Business Law
Corporate Finance
Finance
Economics
Auditing
Hire a Tutor
AI Study Help
New
Search
Search
Sign In
Register
study help
business
applied statistics and multivariate
Questions and Answers of
Applied Statistics And Multivariate
Using the depression data set described in Tables 3.4 and 3.5, create a variable equal to the negative of one divided by the cubic root of income. Display a normal probability plot of the new
Using the mice data, create a profile plot for the average weight of mice per group over time.
Using a scatterplot matrix, repeat the Problem 4.8 for fathers’ measurements instead of those of the oldest child. Did you find the same pattern of relationships between body measurements and FEV1
Using the parental HIV data set create a few visualizations to explore the relationship between the variables of interest listed below. In a few sentences describe the information about the given
Using the lung function data explore and describe the following relationships:a) How does the residential area affect the lung function of the parents?b) For the oldest child, plot the relationship
Construct a scatterplot of income versus employment status from the depression data set. From the data in this table, decide if there are any adults whose incomes are unusual considering their
For the lung cancer data set,a) produce a separate histogram of the variable Days for small and large tumor sizes (0 and 1 values of the variable Staget)b) compute a two-way frequency table of the
For the lung function data set, produce a two-way table of gender of child 1 versus gender of child 2 (for families with at least two children). Describe the distribution of genders for these
For the lung cancer data set,a) construct a histogram of the variable Daysb) for every other variable produce a frequency table of all possible values.
Construct histograms for mothers’ and fathers’ heights and weights from the lung function data set. Describe cases that you consider to be outliers.
For the lung function data set, create a new variable called AGEDIFF = (age of child 1) – (age of child 2) for families with at least two children. Produce a frequency count of this variable.Are
For the depression data set, determine if any of the variables have observations that do not fall within the ranges given in Table 3.4, codebook for depression data.
From the lung function data set, determine how many families have one child, two children, and three children between the ages of 7 and 18.
From the variables ACUTEILL and BEDDAYS described in Table 3.4, create a single variable that takes on the value 1 if the person has been both bedridden and acutely ill in the last two months and
In the Parental HIV data set, the variable LIVWITH (who the adolescent was living with) was coded 1=both parents, 2=one parent, and 3=other. Transform the data so it is coded 1=one parent, 2=two
Consistency checks are sometimes performed to detect possible errors in the data. If a data set included information on sex, age, and use of contraceptive pill, describe a consistency check that
Combine the results from the following two questions into a single variable that measures the total number of days the individual has been sick during the time period.: This would allow one variable
For the statistical package you intend to use, describe how you would add data from three more time periods for the same subjects to the depression data set.
Describe the person in the depression data set who has the highest total CESD score.
Transfer or read in a data set that was entered into a spreadsheet program into your statistical software package.
Using the data set entered in the previous problem, delete the P/E variable for the Dow Chemical company and D/E for Stauffer Chemical and Nalco Chemical in a way appropriate for the statistical
Enter the data set given in Table 9.1, Chemical companies’ financial performance (Section 9.3), using a data entry program of your choice. Make a codebook for this data set.
Give an example from a field that you are familiar with of an increased sophistication of measuring that has resulted in a measurement that used to be ordinal now being interval.
The Parental HIV data set described in Appendix A includes the following variables: job status of mother (JOBMO, 1=employed, 2=unemployed, and 3=retired/disabled) and mother’s education (EDUMO,
Data that are ordinal are often analyzed by methods that Stevens reserved for interval data.Give reasons why thoughtful investigators often do this.
Give an example of nominal, ordinal, interval, and ratio variables from a field of application you are familiar with.
If the RELIG variable described in Table 3.4 of this text was recoded 1 = Catholic, 2 = Protestant, 3 = Jewish, 4 = none, and 5 = other, would this meet the basic empirical operation as defined by
From a field of statistical application (perhaps your own field of specialty), describe a data set and repeat the procedures described in Problem 2.3.
Repeat Problem 2.3 for the lung cancer data set described in Table 13.1.
For the chronic respiratory study data described in Appendix A, classify each variable according to Stevens’s scale and according to whether it is discrete or continuous. Pose two possible research
In a survey of users of a walk-in mental health clinic, data have been obtained on sex, age, household roster, race, education level (number of years in school), family income, reas for coming to the
Classify the following types of data by using Stevens’s measurement system: decibels of noise level, father’s occupation, parts per million of an impurity in water, density of a piece of bone,
For the school example and GEE marginal approach we mentioned that the most appropriate correlation structure is exchangeable. Give reasons why the AR(1) or the unstructured options for correlation
For the mice data, instead of modeling weight linearly over time, model weight as a quadratic function of time by including a term for days as well as for days2. Which model (random intercept, random
There might be siblings represented in the school data set. The factor parental education could potentially be considered another level in the hierarchical model. Give reasons for when and why this
For the school data set (again, using math score as the outcome variable) start with fitting a model with the following fixed effects: SES centered around its respective school mean, school mean SES,
For the school data set (again, using math score as the outcome variable) fit the following models:a) A random intercept model with random intercepts for schools and both the raw SES scores and the
For the school data set (again, using math score as the outcome variable) fit a random intercept model with random intercepts for schools and SES centered around its respective school mean as a fixed
For the school data set using math score as the outcome variable, fit the following models:a) A fixed effects model with schools and SES as fixed effects.b) The same as (a), but with each SES
For the school data set generate box plots of SES by schools (similar to Figure 18.2). Interpret the graph with respect to potential differences in mean SES and differences in variability of SES
Three students have the following scores on their math, english and social science classes.Student 1: 87.3, 91.2 and 86.0, Student 2: 75.4, 81.3 and 79.6, Student 3: 98.8, 95.0 and 94.7.a) Using a
(Problem 17.9 continued) Compare the results you get from Problem 17.9 and Problem 12.30.
This problem uses the Northridge earthquake data set. Look for significant associations in homeowner status (V449), home evacuation status (V173), and status of home damage (V127)using a log-linear
Look for significant associations among the variables gender, currently living with(LIVWITH), the financial situation (FINSIT), and having enough money for food (MONFOOD)in the Parental HIV data
In Problem 17.5, eliminate the four-way interaction, then compare the two models: the one with and the one without Smokfu. Interpret the results.
Rerun the analyses given in Problem 17.4 adding a delta of 0.01, 0.1, and 0.5 to see if it changes any of the results.
Run a four-way log-linear analysis using the variables Stagen, Hist, Smokfu and Death in the lung cancer data set. Report on the significant associations that you find.
Perform a log-linear analysis using data from the lung cancer data set described in Section 13.3 and Appendix A. Check if there are any significant associations among Staget, Stagen and Hist. Which
Split the variable EDUCAT in the depression data set into two groups, those who completed high school and those who did not. Also split INCOME at 18 or less and greater than 18 (this is thousands of
Run a log-linear analysis using the variables DRINK, CESD (split at ten or less), and TREAT from the depression data set to see if there is any significant association among these variables.
Using the variables AGE and CESD from the depression data, make two new categorical variables called CAGE and CCESD. For CAGE, group together all respondents that are 35 years old or less, 36 up to
For the Parental HIV data consider the subgroup of adolescents who have used marijuana. Perform a hierarchical cluster analysis separately for females on the following variables from the Parental HIV
Repeat Problem 16.1, using the variables age, income, and education instead of the last seven variables.
Create a data set from the family lung function data described in Appendix A as follows. It will have three times the number of observations that the original data set has—the first third of the
Repeat Problem 16.6, using the K-means method for K = 4. Compare the results with the four clusters produced in Problem 16.6.
Repeat Problem 16.6, using AREA as an additional clustering variable. Comment on your results.
For the family lung function data described in Appendix A, perform a hierarchical cluster analysis using the variables FEV1 and FVC for mothers, fathers, and oldest children. Compare the distribution
Describe how you would expect guards, forwards, and centers in basketball to cluster on the basis of size or other variables. Which variables should be measured?
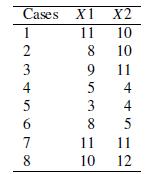
For the accompanying small, hypothetical data set, plot the data by using methods given in this chapter, and perform both hierarchical and K-means clustering with K = 2. Cases X1 X2 1 11 10 2 3 8 10
Perform a cluster analysis on the chemical company data in Table 9.1, using the K-means method for K = 2;3; 4.
For the situation described in Problem 8.7, modify the data for X1, X2,. . . , X9 as follows. For the first 25 cases, add 10 to X1, X2, X3. For the next 25 cases, add 10 to X4, X5, X6. For the
For the depression data set, use the last seven variables to perform a cluster analysis producing two groups. Compare the distribution of CESD and cases in the groups. Compare also the distribution
This problem uses the Northridge earthquake data set. Perform a factor analysis on the following items in the Brief Symptom Inventory (BSI): V346, V357, V364, V383, V390, V394, V351, V358, V385,
Repeat Problem 15.8 using an oblique rotation. Do the substantive conclusions change?
Perform a factor analysis on all of the items of the Parental Bonding scale for the Parental HIV data (see Appendix A and the codebook). Retain two factors. Rotate the factors using an orthogonal
For the depression data set, perform four factor analyses on the last seven variables DRINK–CHRONILL (Table 3.4 or 3.5). Use two different initial extraction methods and both orthogonal and oblique
Separate the depression data set into two subgroups, men and women. Using four factors, repeat the factor analysis in Table 15.7. Compare the results of your two factor analyses to each other and to
For the data generated in Problem 8.7, perform four factor analyses, using two different initial extraction methods and both orthogonal and oblique rotations. Interpret the results.
Perform a factor analysis on the data in Table 9.1 and explain any insights this factor analysis gives you.
Another method of factor extraction, maximum likelihood, was mentioned in Section 15.6 but not discussed in detail. Use one of the packages which offers this option to analyze the data along with an
Repeat the analysis of Problem 15.1 and Table 15.7, but use an iterated principal factor solution instead of the principal components method. Compare the results.
The CESD scale items (C1–C20) from the depression data set in Chapter 3 were used to obtain the factor loadings listed in Table 15.7. The initial factor solution was obtained from the principal
Perform a principal components analysis on all the items of the Parental Bonding scale for the Parental HIV data (see Appendix A and the codebook). How many principal components would you expect to
Perform a principal components analysis on AGE and INCOME using the depression data set.Include all the additional data points listed in Problem 7.9(b). Plot the original variables and the principal
Using the family lung function data, perform a principal components analysis on mother’s height, weight, age, FEV1, and FVC. Use the covariance matrix, then repeat using the correlation matrix.
(Continuation of Problem 14.7.) Perform a regression of FEV1 for the oldest child on the principal components found in Problem 14.7. Compare the results to those from Problem 8.15.
Using the family lung function data, perform a principal components analysis on age, height, and weight for the oldest child.
Using the family lung function data described in Appendix A define a new variable RATIO= FEV1/FVC for the fathers. What is the correlation between RATIO and FEV1? Between RATIO and FVC? Perform a
Perform a principal components analysis on the data in Table 9.1(not including the variable P/E). Interpret the components. Then perform a regression analysis with P/E as the dependent variable,
(Continuation of Problem 14.3.) Perform the regression of Y on the principal components.Compare the results with the multiple regression of Y on X1 to X9.
For the data generated in Problem 8.7, perform a principal components analysis on X1;X2; : : : ;X9. Compare the results with what is known about the population.
(Continuation of Problem 14.1.) Perform a regression analysis of CASES on the last seven variables as well as on the principal components. What does the regression represent? Interpret the results.
For the depression data set described in Appendix A, perform a principal components analysis on the last seven variables DRINK–CHRONILL (Table 3.5). Interpret the results.
Perform a proportional hazards regression using the variables Staget, Treat, and Perfbl and stratify the model by Poinf. Compare the estimated hazard ratios to the ones obtained in Problem 13.9.
Evaluate graphically and statistically the proportional hazards assumption for the variables Perfbl, Poinf, and Treat in the model presented in Table 13.4 using the methods described in Section 13.8.
Define a variable Smokchng that measures change in smoking status between baseline and follow-up, so that Smokchng equals 1 if a person changes from being a smoker to being an ex-smoker and equals 0
Repeat Problem 13.6assuming a proportional hazards model.
Assuming a log-linear model, do the effects of smoking status upon survival change depending on the tumor size at diagnosis?
Repeat Problem 13.4assuming a proportional hazards model.
Assuming a log-linear model for survival, does smoking status (i.e., the variables Smokbl and Smokfu) significantly affect survival?
Do the patterns of censoring appear to be the same for smokers at baseline, ex-smokers at baseline, and nonsmokers at baseline? What about for those who are smokers, ex-smokers, and nonsmokers at
Repeat Problem 13.1, using a Cox proportional hazards model instead of a log-linear. Compare the results.
(a) Find the effect of Stagen and Hist upon survival by fitting a log-linear model. Check any assumptions and evaluate the fit using the graphical methods described in this chapter.(b) What happens
(Problem 12.30continued) Using an appropriate method in your software package, obtain confidence intervals for the odds ratios you computed in partsa, b and c of Problem 12.30.
(Problem 12.29continued) Fit a logistic regression model (again using as the outcome “evacuate home” (V173)) which includes as the only covariates home owner status (rent/own, V449)and status of
This problem and the following ones also use the Northridge earthquake data set. Perform an appropriate regression analysis using variable selection techniques for the following outcome:evacuate home
(Problem 12.22continued) Perform diagnostic procedures to identify influential observations.Remove the four (4) most influential observations using the delta chi-square method. Rerun the analysis and
(Problem 12.22continued) Is there an interaction effect between age and home ownership, controlling for gender and ethnicity?
(Problem 12.22continued) Is there an interaction effect between gender and home ownership?That is, are the estimated effects of home ownership upon reporting emotional injuries different for men and
(Problem 12.22continued) Are the effects of ethnicity upon reporting emotional injuries statistically significant, controlling for home ownership status, age, and gender? Use a likelihood ratio test
Showing 200 - 300
of 2180
1
2
3
4
5
6
7
8
9
10
11
12
13
14
15
Last