

An isocost curve shows the different combinations of two goods that can be purchased with a given
Question:
An isocost curve shows the different combinations of two goods that can be purchased with a given budget B. Blast furnaces can be heated with either gas (x) or coal (y). Given px = 100, py = 400, and B = 8000,
(a) draw the isocost curve. Always starting from the original data, draw a new isocost curve
(b) if B increases by 50 percent,
(c) if px doubles, and
(d) if py decreases by 37.5 percent.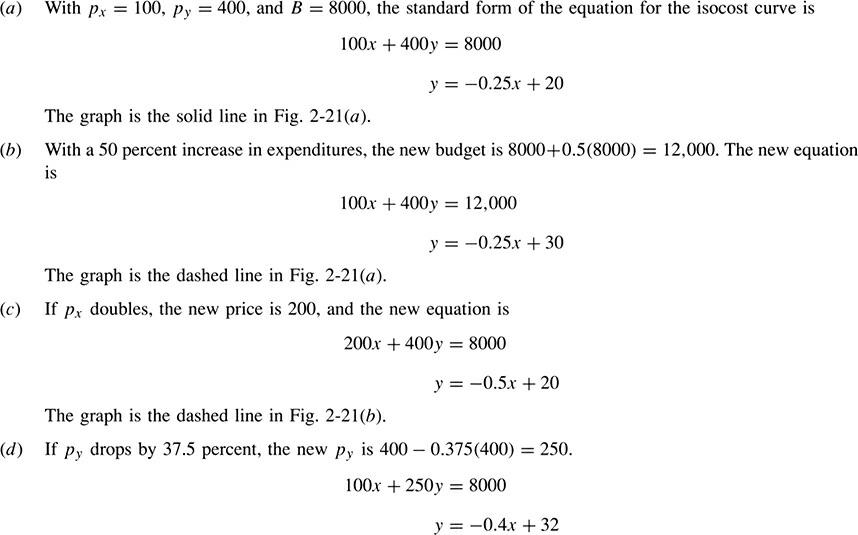
The graph appears as a dashed line in Fig. 2-21(c).
Step by Step Answer:

This question has not been answered yet.
You can Ask your question!
Related Book For 
Schaum S Outline Of Mathematical Methods For Business Economics And Finance
ISBN: 978-1264266876
2nd Edition
Authors: Luis Moises Pena Levano
Question Posted:
