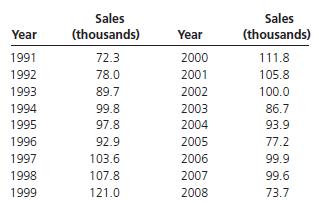
The following data show U.S. retail sales of canoes from 1991 through 2008, with data in thousands
Question:
The following data show U.S. retail sales of canoes from 1991 through 2008, with data in thousands of boats.

a. Construct a graph of the time series. Does the overall trend appear to be upward or downward?
b. Construct a three-year centered moving average for this series.
c. Using the constant 5 0.3, fi t an exponentially smoothed curve to the original time series.
d. Repeat part
(c) using 5 0.7. How has the new value for the constant affected the smoothness of the fi tted curve?
Fantastic news! We've Found the answer you've been seeking!
Step by Step Answer:
Related Book For 

Question Posted:


