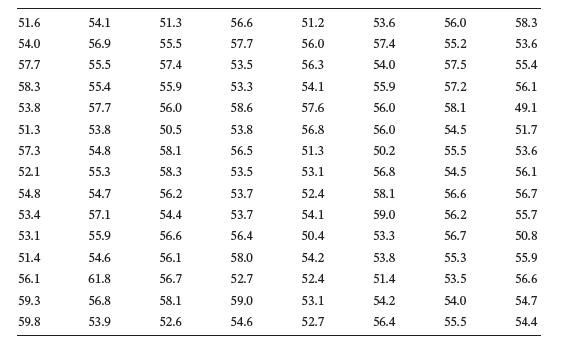
2. In a survey on the health status of preschool children, researchers conducted physical examinations of preschool
Question:
2. In a survey on the health status of preschool children, researchers conducted physical examinations of preschool children aged 4-5 years in a daycare center. Table 2.15 shows the numerical data on chest circumference for 120 healthy preschool boys.

(a) Describe the data using graphics, and summarize the distribution characteristics using statistics. Justify your choices between the possible alternative methods.
(b) What is the difference between calculating the statistics using the direct method or the weighted method?
(c) Suppose that the unit of chest circumference was meters instead of centimeters;
how would the distribution and the statistics change?
(d) Suppose that height and weight data for the 120 preschool boys were also available;
how would you determine and compare the degree of dispersion across the measurements? Please state your suggestion.
Step by Step Answer:


