

Here is a scatterplot showing the regression line, 95% confidence interval, and 95% prediction interval, using 2005
Question:
Here is a scatterplot showing the regression line, 95% confidence interval, and 95% prediction interval, using 2005 youth unemployment data for a sample of 57 nations. The response variable is the Male Rate, and the predictor variable is the Female Rate.
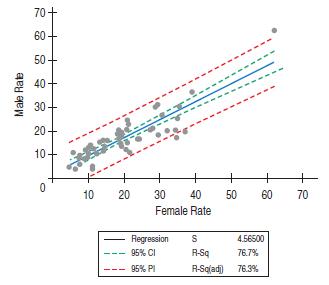
a) Explain the meaning of the 95% prediction interval in this context.
b) Explain the meaning of the 95% confidence interval in this context.
c) Identify the unusual observation, and discuss its potential impact on the regression.
Fantastic news! We've Found the answer you've been seeking!
Step by Step Answer:

Answered By
Rohith Bellamkonda
I am studying in IIT Indore,the most prestigious institute of India.I love solving maths and enjoy coding
1+ Reviews
10+ Question Solved
Related Book For 

Business Statistics
ISBN: 9780321716095
2nd Edition
Authors: Norean D. Sharpe, Paul F. Velleman, David Bock, Norean Radke Sharpe
Question Posted:
