

Pizza ratings, part 3. In Exercise 19, we raised questions about two gourmet pizzas. After removing them,
Question:
Pizza ratings, part 3.
In Exercise 19, we raised questions about two gourmet pizzas. After removing them, the resulting regression looks like this.
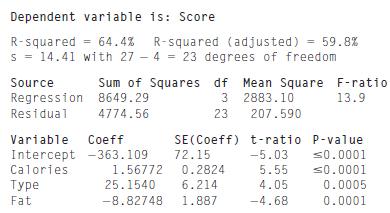
A plot of the residuals against the predicted values for this regression looks like this. It has been colored according to the Type of pizza.
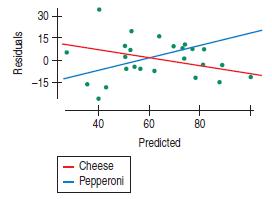
a) What does this plot say about how the regression model deals with these two types of pizza?
We constructed another variable consisting of the indicator variable Type multiplied by Calories. Here’s the resulting regression.
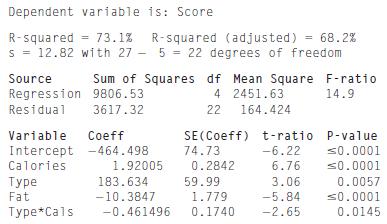
b) Interpret the coefficient of Type*Cals in this regression model.
c) Is this a better regression model than the one in Exercises 17 and 19?
Step by Step Answer:

This question has not been answered yet.
You can Ask your question!


Business Statistics
ISBN: 9780321716095
2nd Edition
Authors: Norean D. Sharpe, Paul F. Velleman, David Bock, Norean Radke Sharpe
