

Share price index. The following shows the regression plot, partial analysis, and residuals plot for Australias monthly
Question:
Share price index. The following shows the regression plot, partial analysis, and residuals plot for Australia’s monthly Share Prices Index by using the year 2010 as the base year for the period January 2016 to December 2019.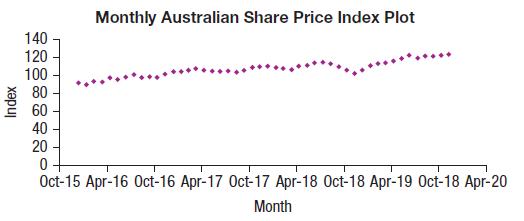
Regression Statistics Multiple R 0.9171 R Square 0.8410 Adjusted R Square 0.8376 Standard Error 3.4701 Observations 48 Variable Coefficient SE(Coeff) t-ratio P-value Intercept -691.7212 51.2067 -13.5084 0.0000 Month 0.0185 0.0012 15.5999 0.0000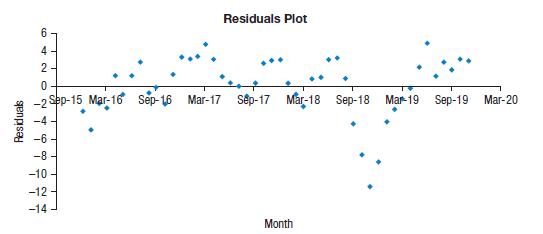
a) What does the R2 value in the regression mean?
b) What features of the residuals should be noted with regard to this regression?
c) What features of the residuals might be dealt with by a re-expression? Which ones would not be helped by a re-expression?
d) Can you use the regression model to help in your understanding of the growth of the market price index?
Step by Step Answer:

This question has not been answered yet.
You can Ask your question!


Business Statistics
ISBN: 9781292269313
4th Global Edition
Authors: Norean Sharpe, Richard De Veaux, Paul Velleman
